

Monitoring, incidents, and status pages for production teams
Know when your product breaks and what to do next.
We monitor your websites, APIs, background jobs, and critical browser workflows, then turn failures into reliable alerts, incident timelines, and clear customer updates.
Free plan available · No credit card required · Paste a domain, first checks live in minutes
Start with a domain
Paste a domain and upti.my discovers the public services worth monitoring. You start with coverage, not a blank list.
Your product is covered
Websites, APIs, jobs, and browser flows are monitored continuously.
Failures are confirmed
Checks verify the signal from multiple locations before anyone is paged.
The right people respond
Alerts route to email, Slack, Discord, or webhooks — and an incident timeline starts.
Customers stay informed
Your status page shows what is happening while the team fixes it.
Production Confidence
You should not have to wonder if production is okay
Your product can look healthy while important work is failing quietly. A homepage can return 200 while login is broken, a cron job is missed, a webhook is stuck, or a checkout flow fails after deploy.
upti.my gives your team a clear answer: what is working, what broke, who was notified, and what customers can see.
Know earlier
Detect failures before customers open support tickets.
Respond clearly
Route alerts, create incidents, and keep the timeline in one place.
Communicate calmly
Update customers through status pages without scrambling during the outage.
Your product is more than a homepage
A 200 OK does not mean your product works. upti.my checks the public and hidden surfaces your customers depend on, from websites and APIs to background jobs and browser workflows — with probe locations on every continent.
Websites and pages
Catch downtime, broken deploys, slow responses, and content that should not be live.
- SaaS homepage and login
- Client websites for agencies
APIs and services
Monitor the endpoints your app, customers, and partners depend on — not only your homepage.
- Public API availability
- Webhook delivery paths
Background jobs
Use heartbeats to catch missed cron jobs, stalled workers, failed imports, and scheduled tasks that stop quietly.
- Daily report generation
- Data import jobs
Browser checks
Run browser checks for signup, login, checkout, onboarding, and other flows where the API being up is not enough.
- Checkout and payment flows
- Signup and onboarding paths
Alerts You Can Trust
Know you will be notified when it matters
An alert is only useful if it reaches the right person with enough context to act. Failures are confirmed from multiple locations before anyone is paged — when upti.my wakes you up, there is a real problem worth waking up for.
And because a monitoring tool has to answer for itself: upti.my monitors upti.my with the same checks it runs for you. Our services average 99.95% measured uptime over the last 90 days, and our full uptime and incident history is public — verify it any time, including right now.
Public upti.my status pageStatus Pages
A clear answer for every state of production
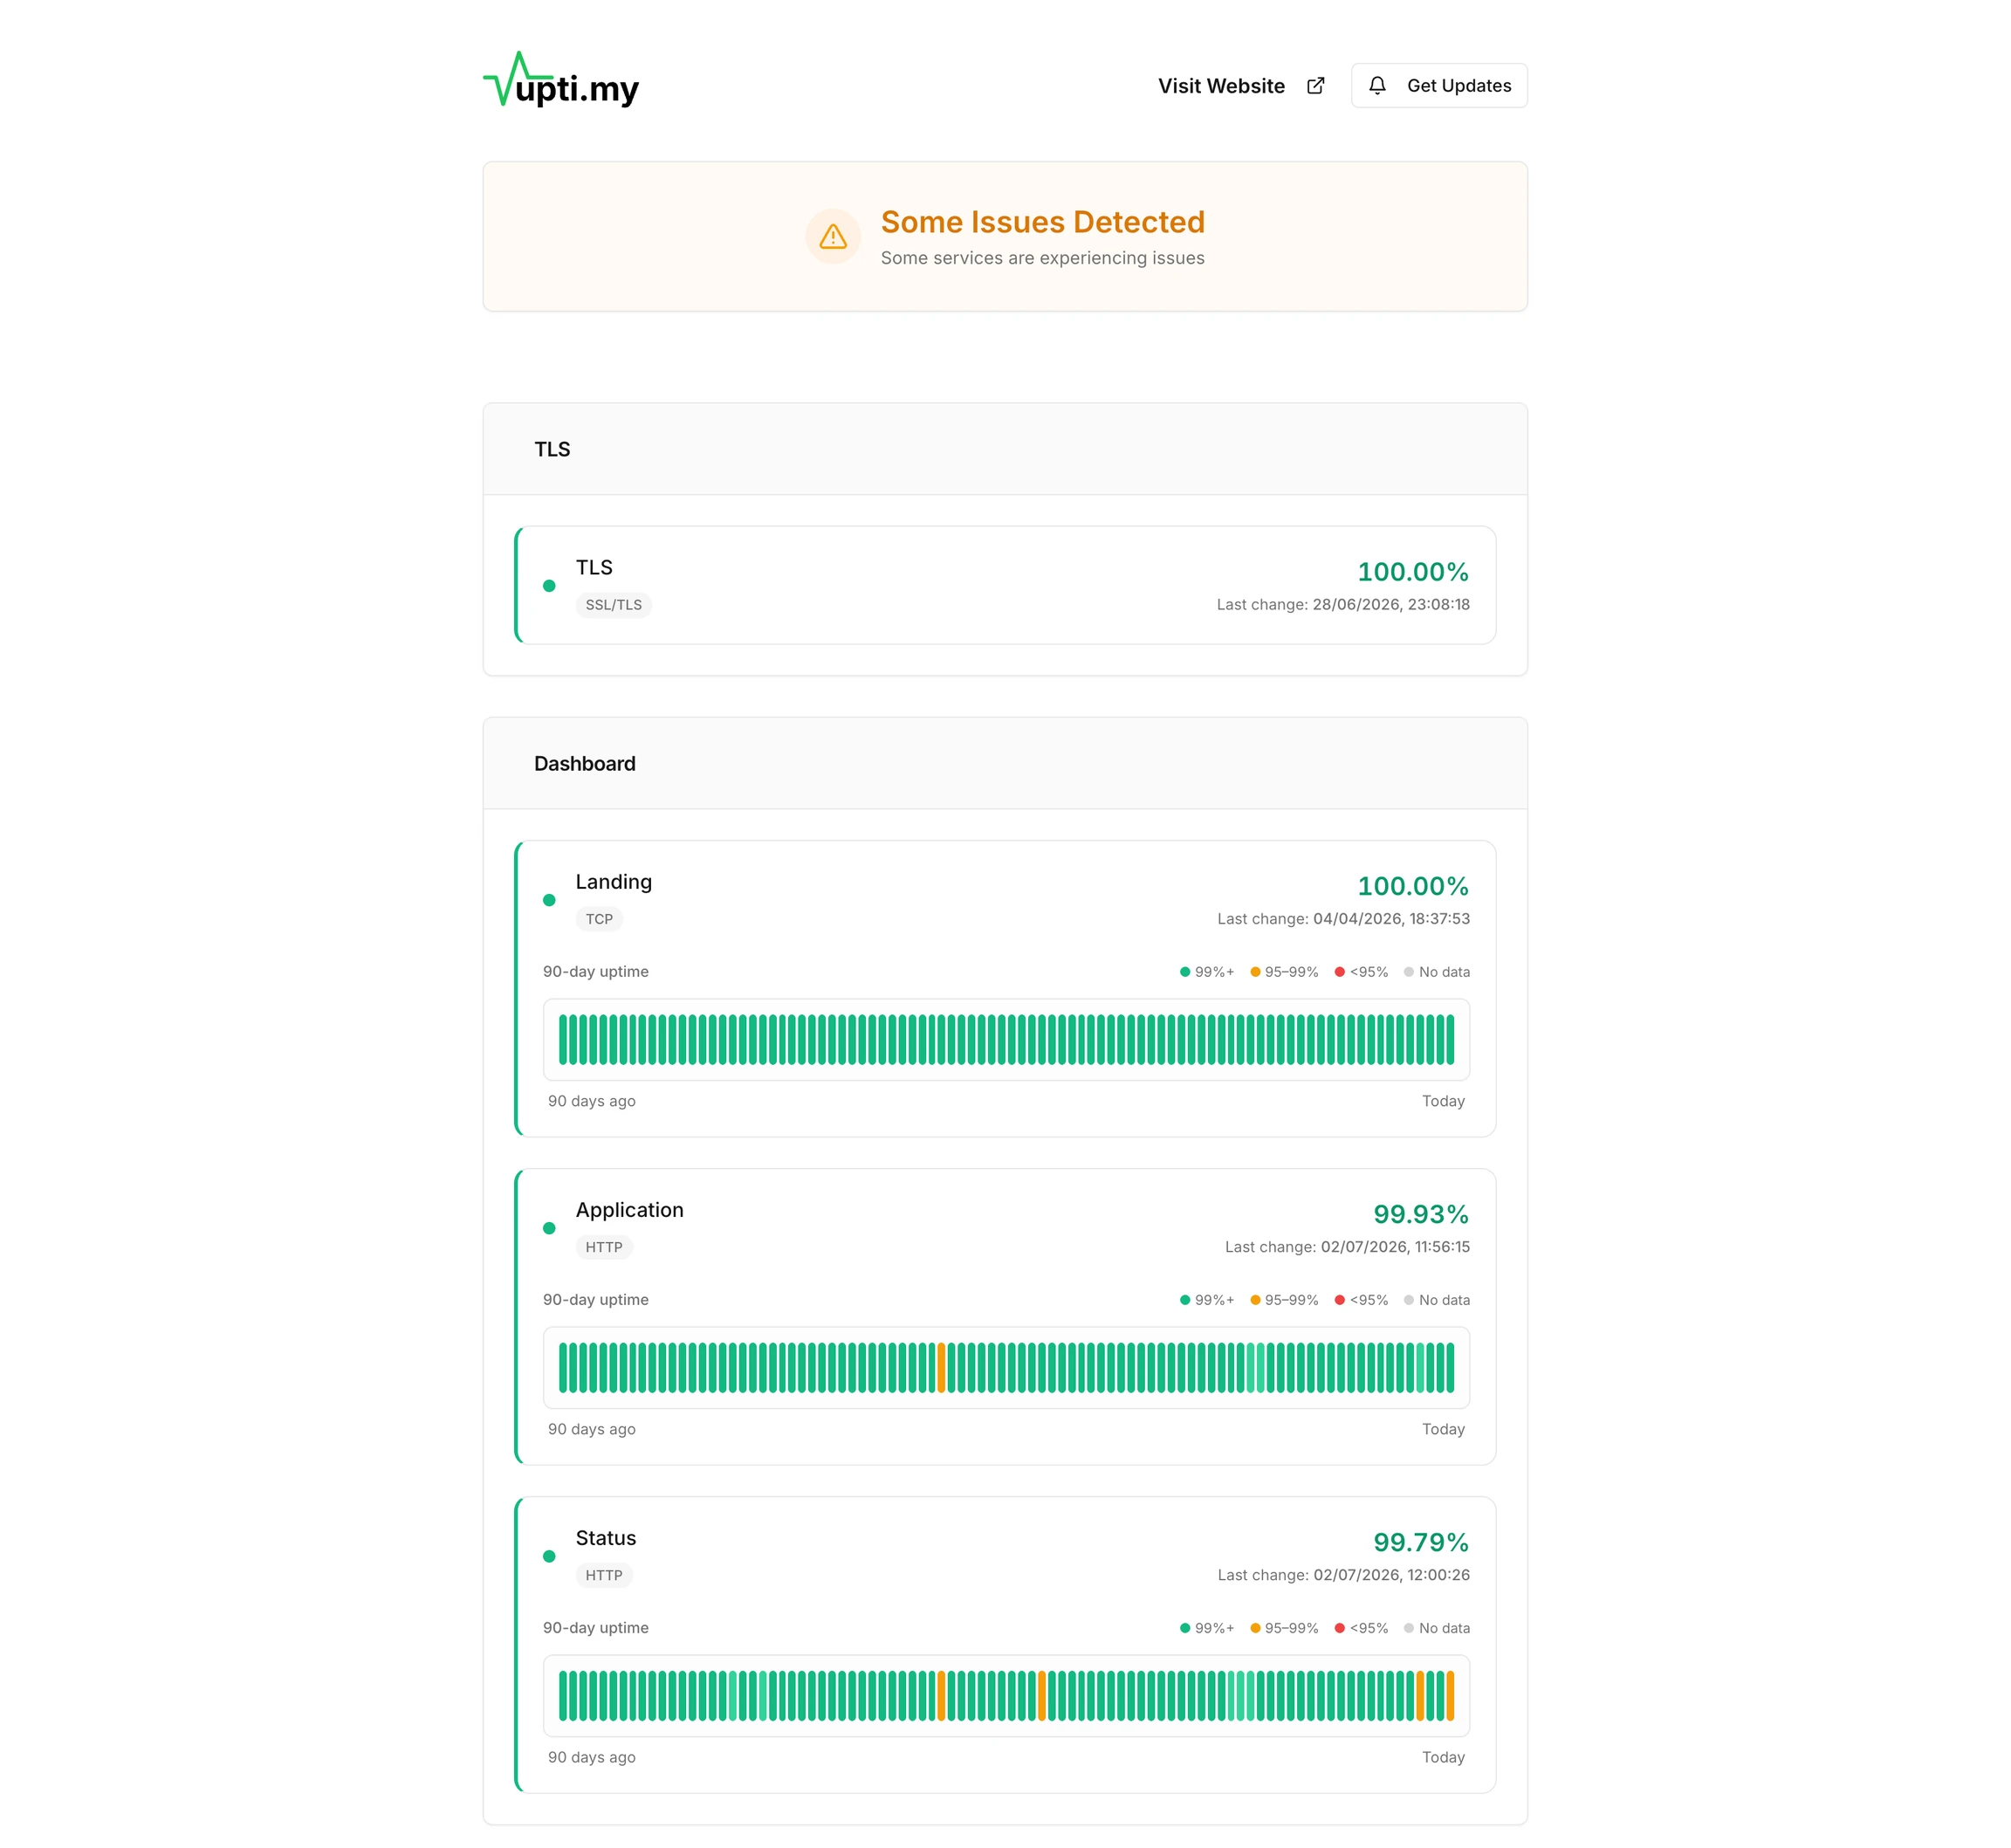
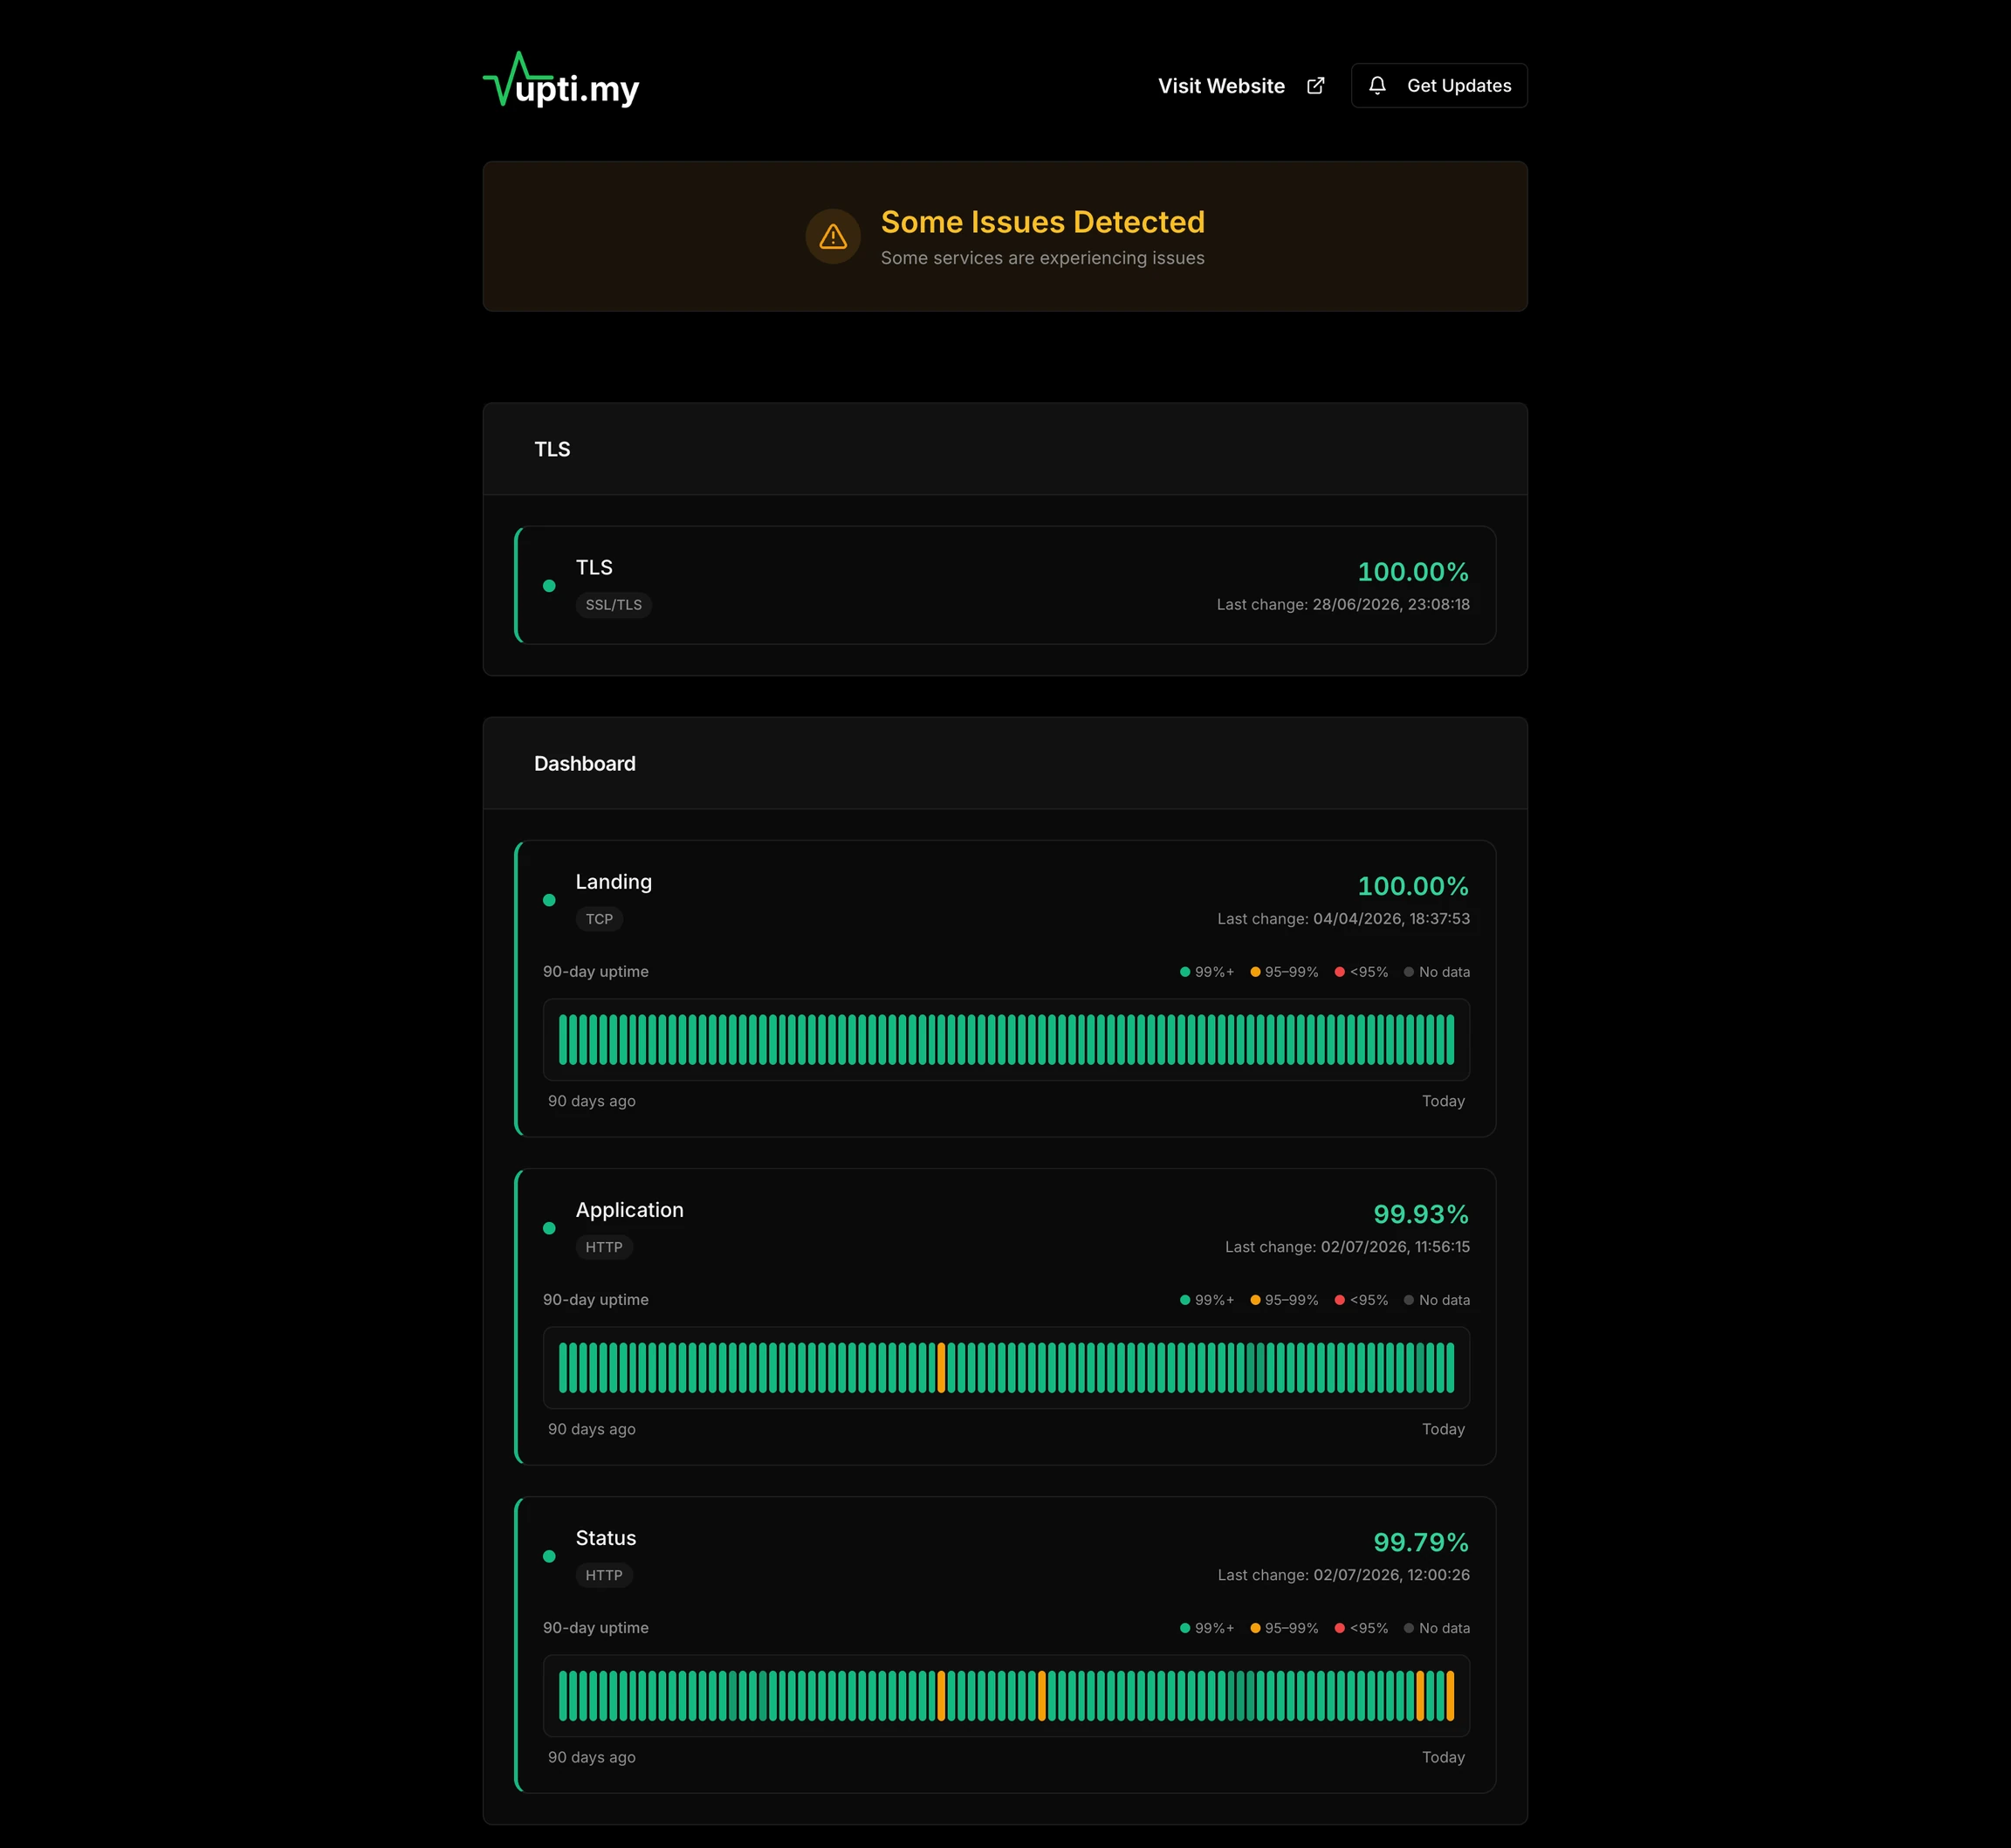
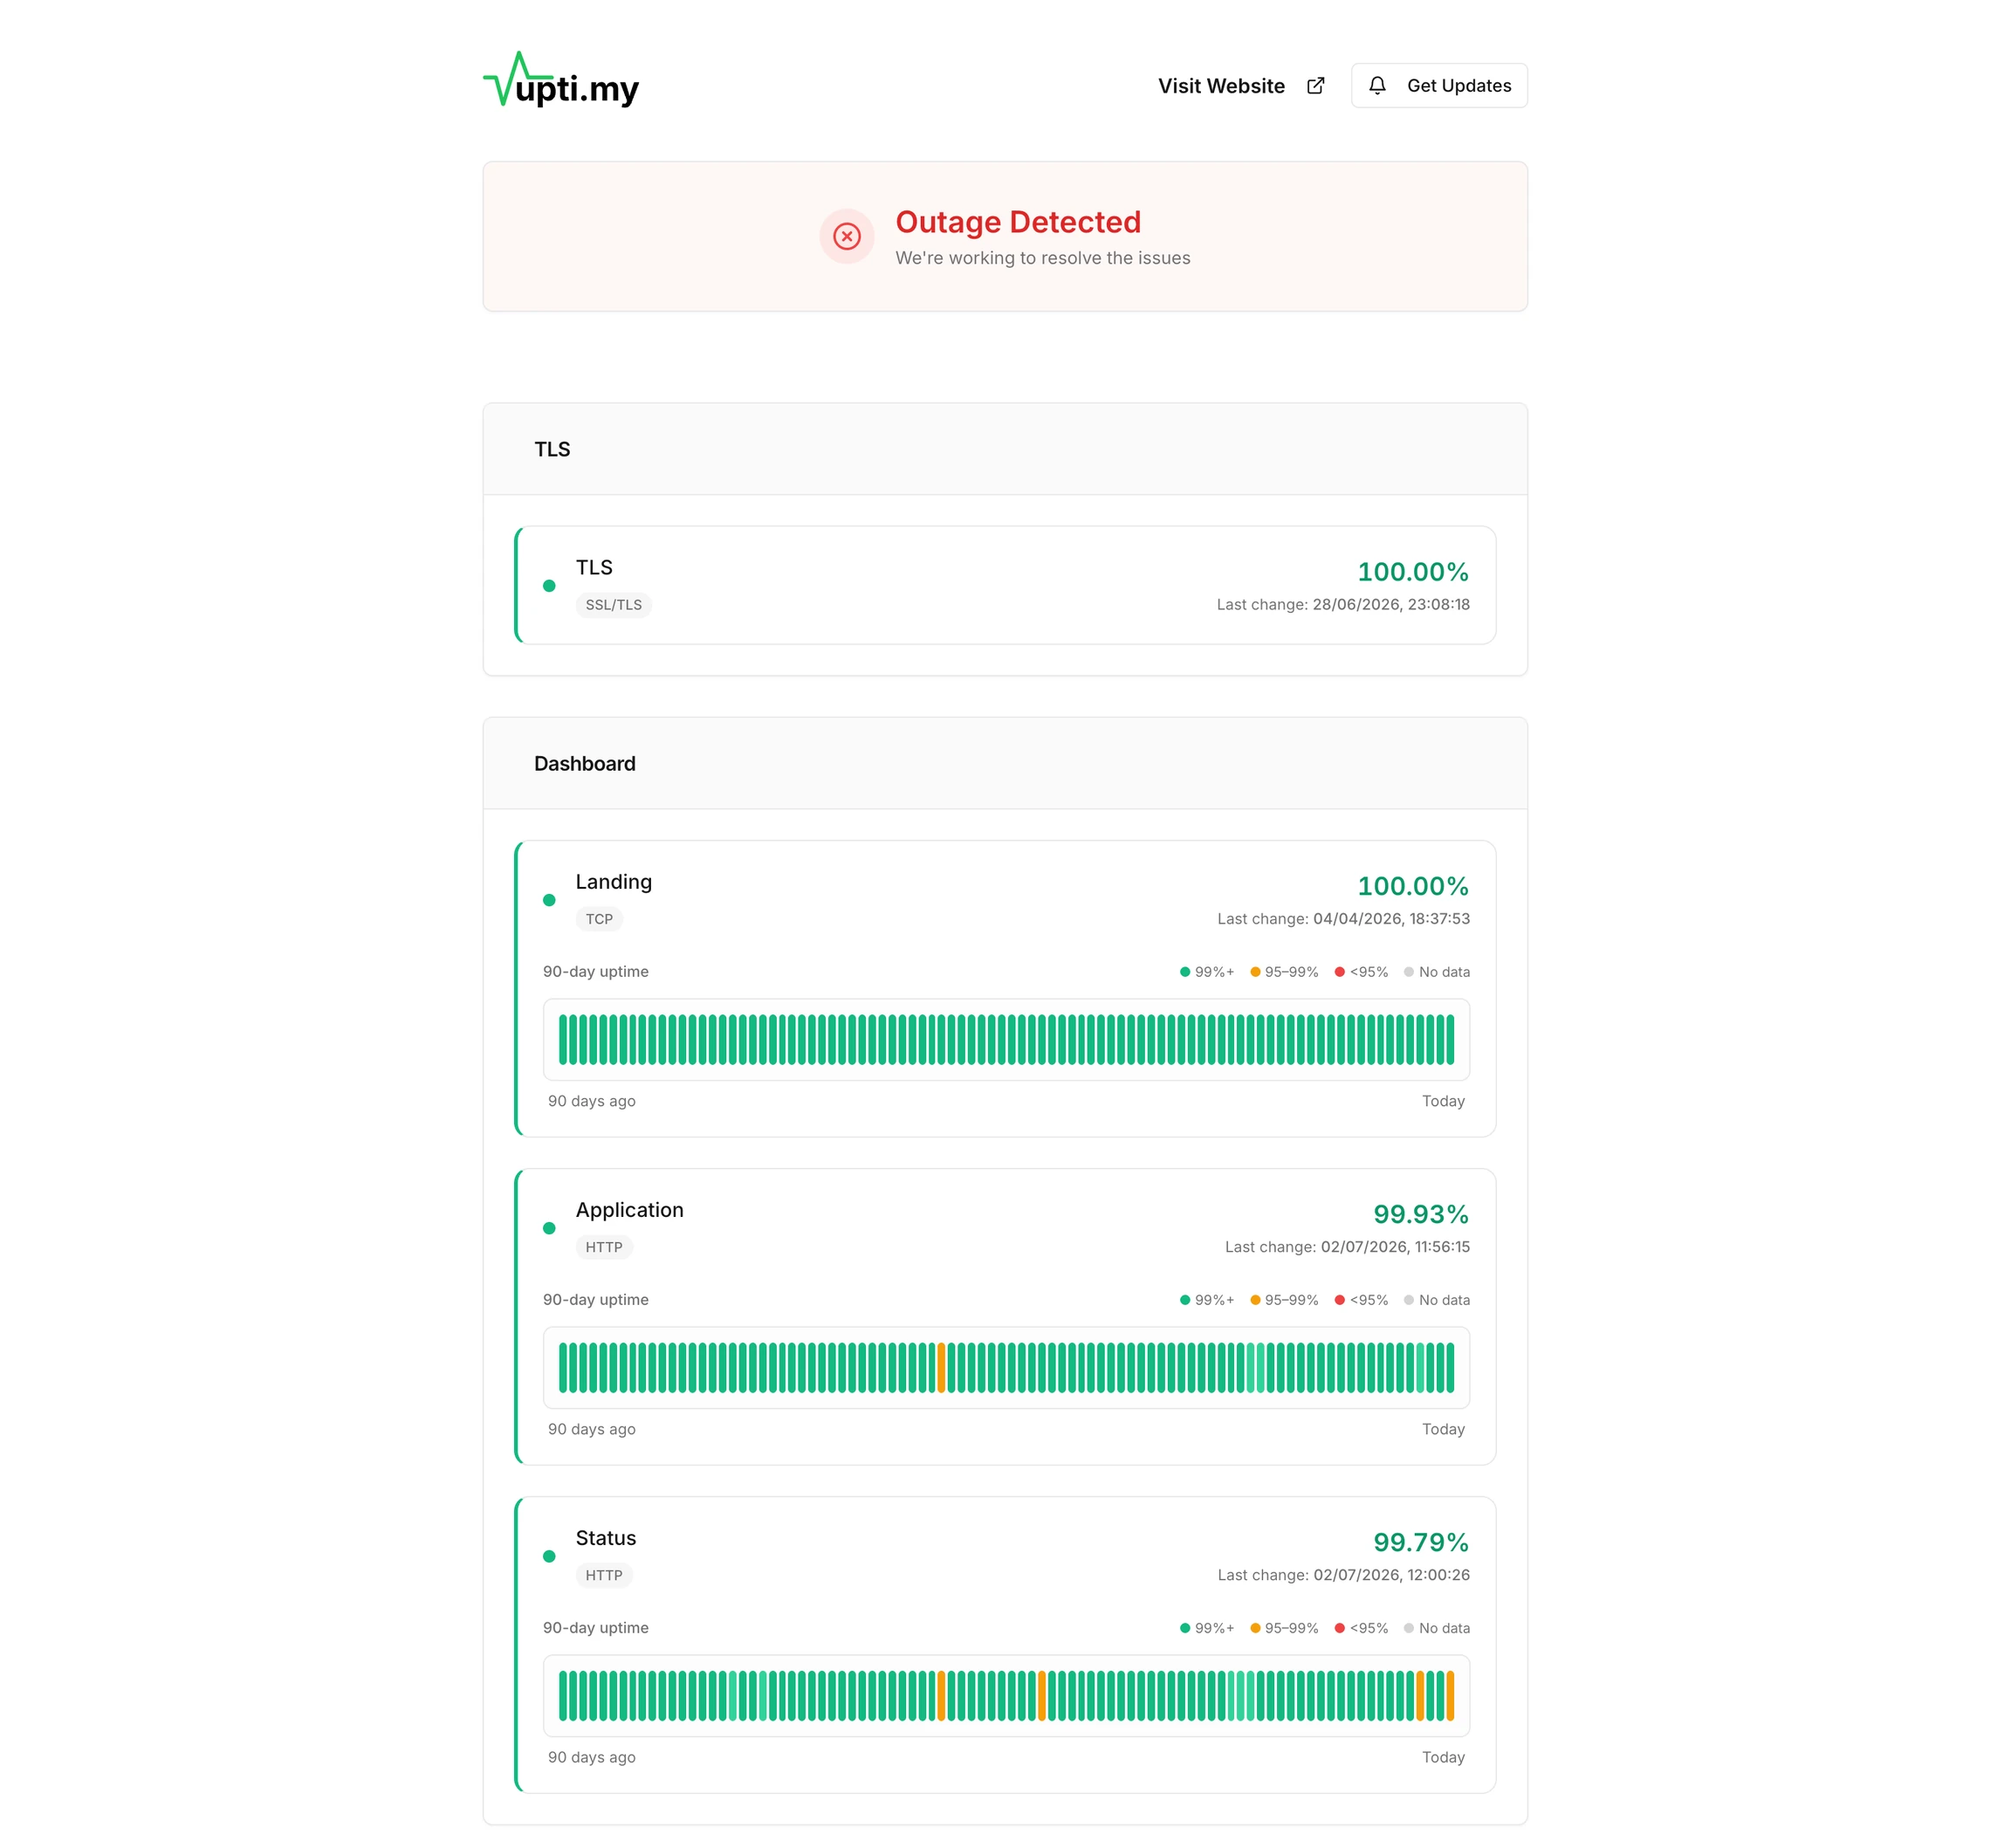
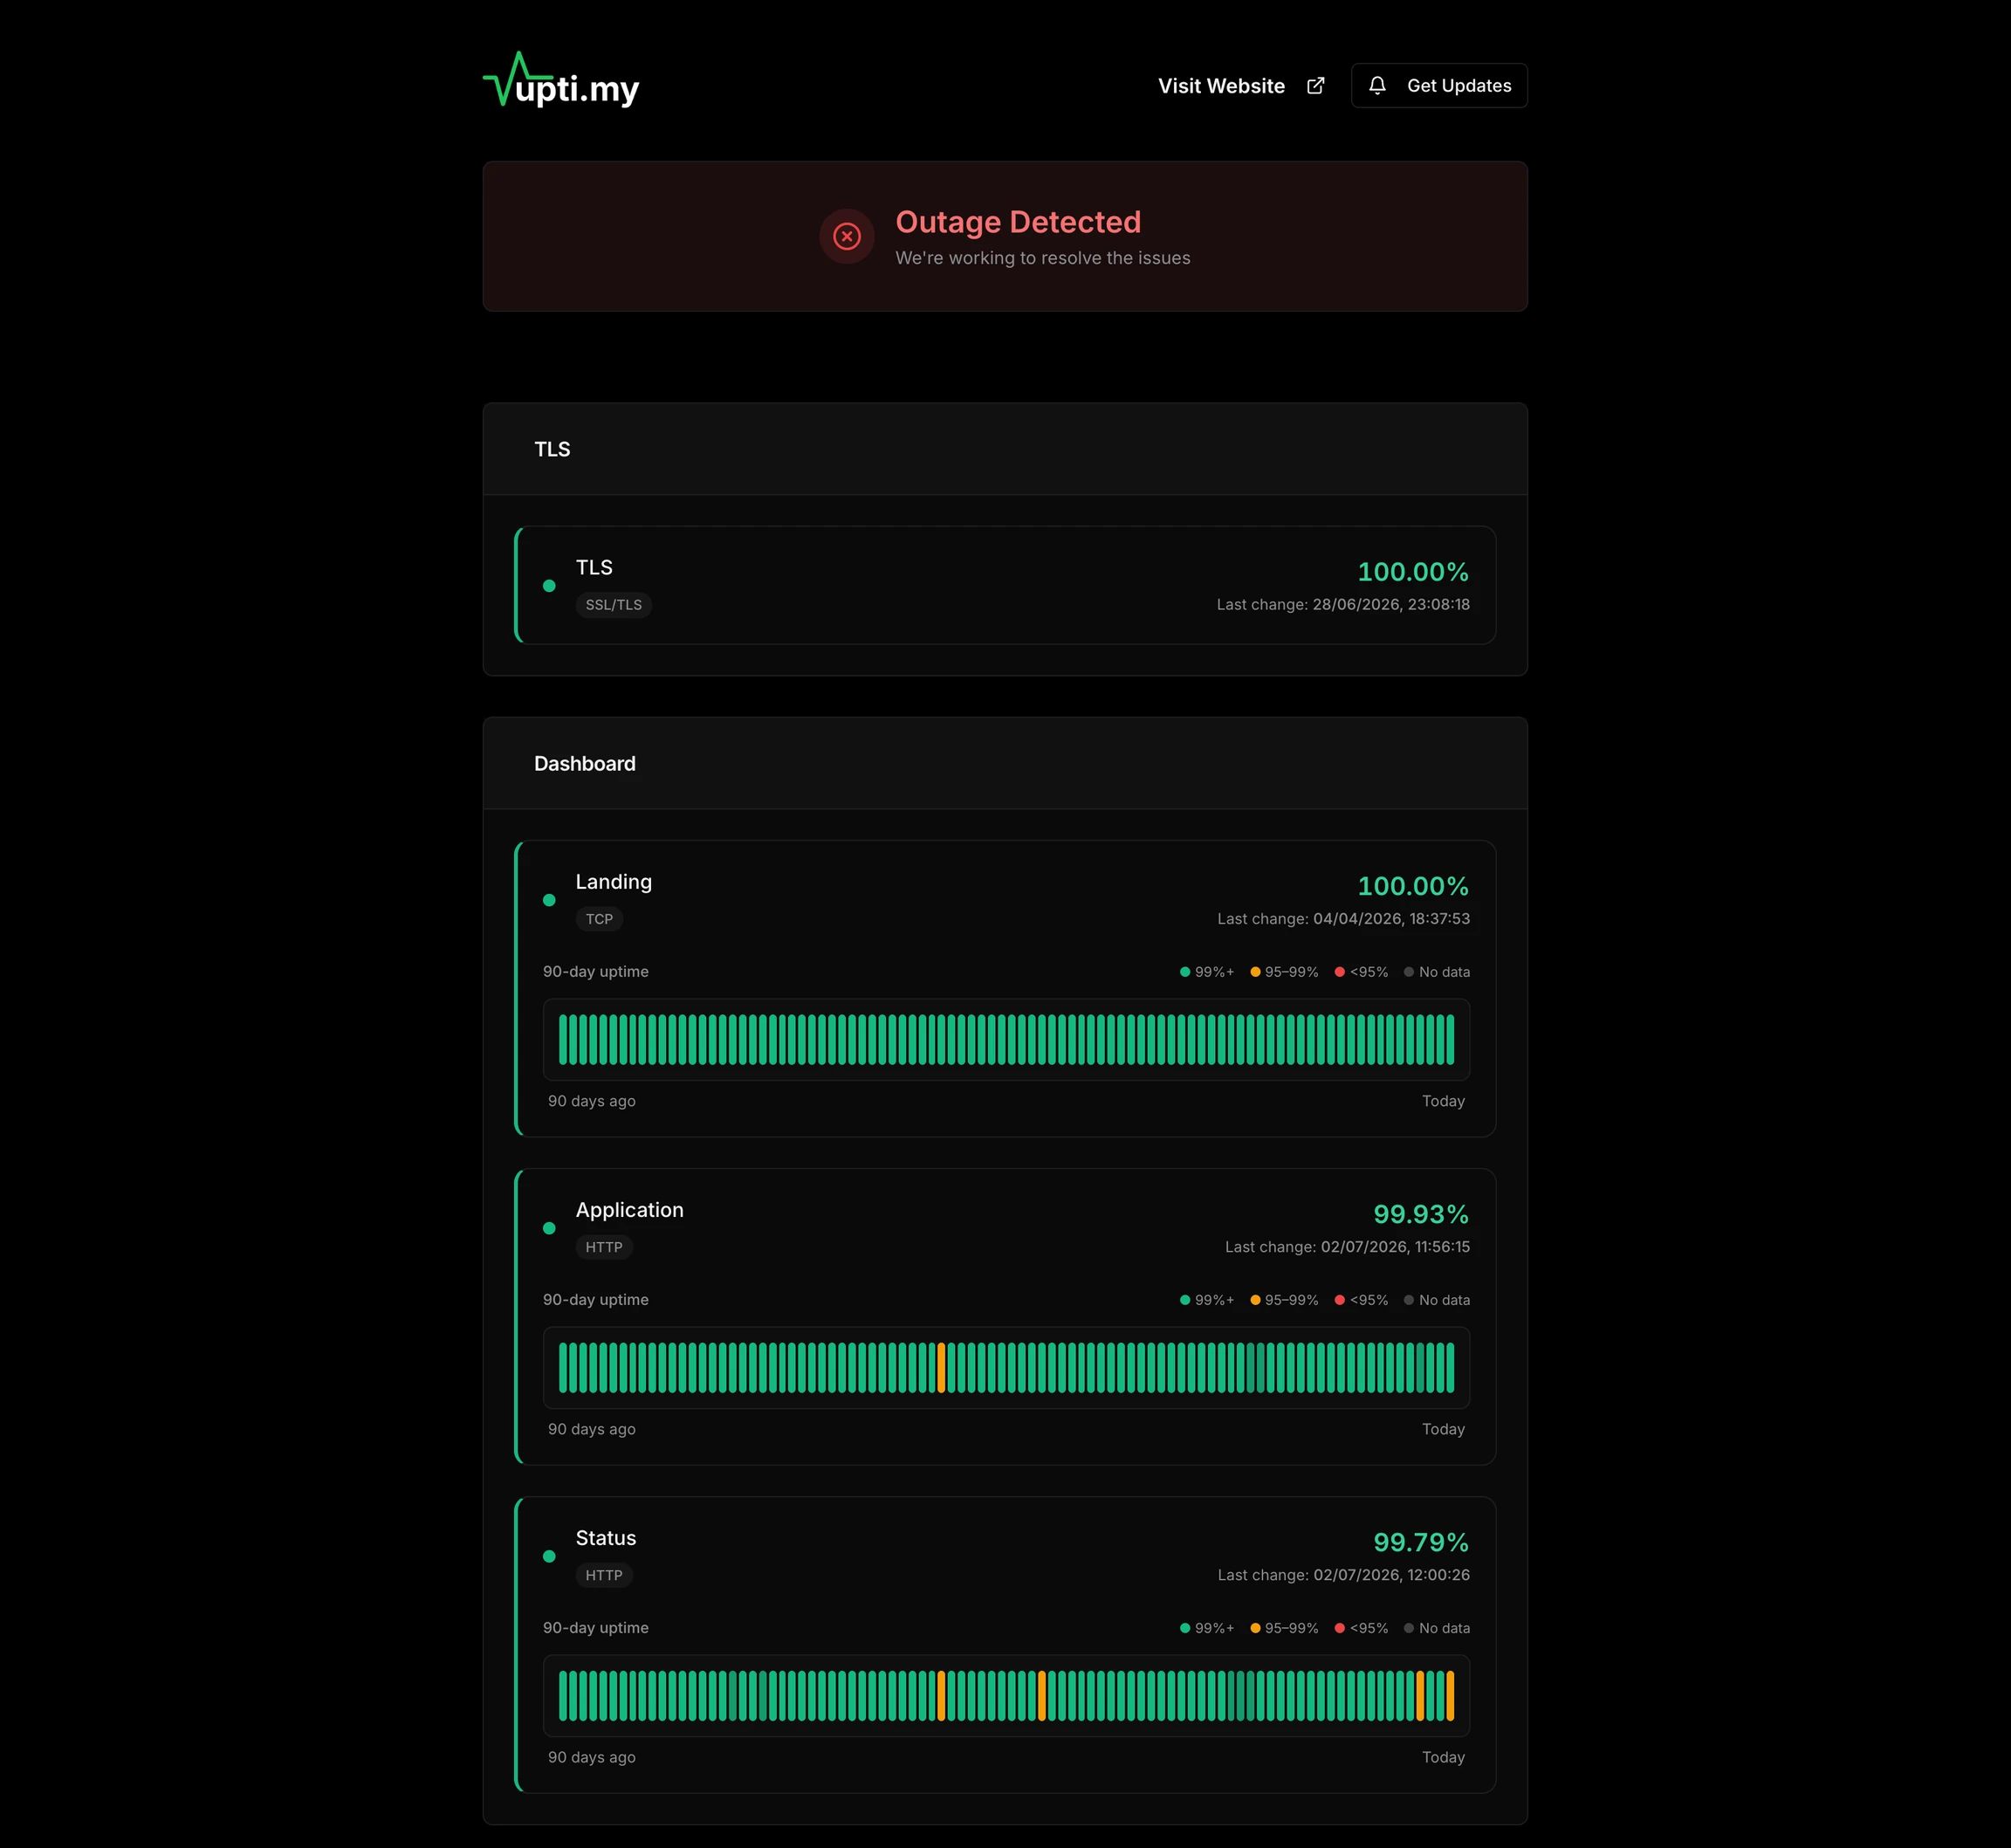
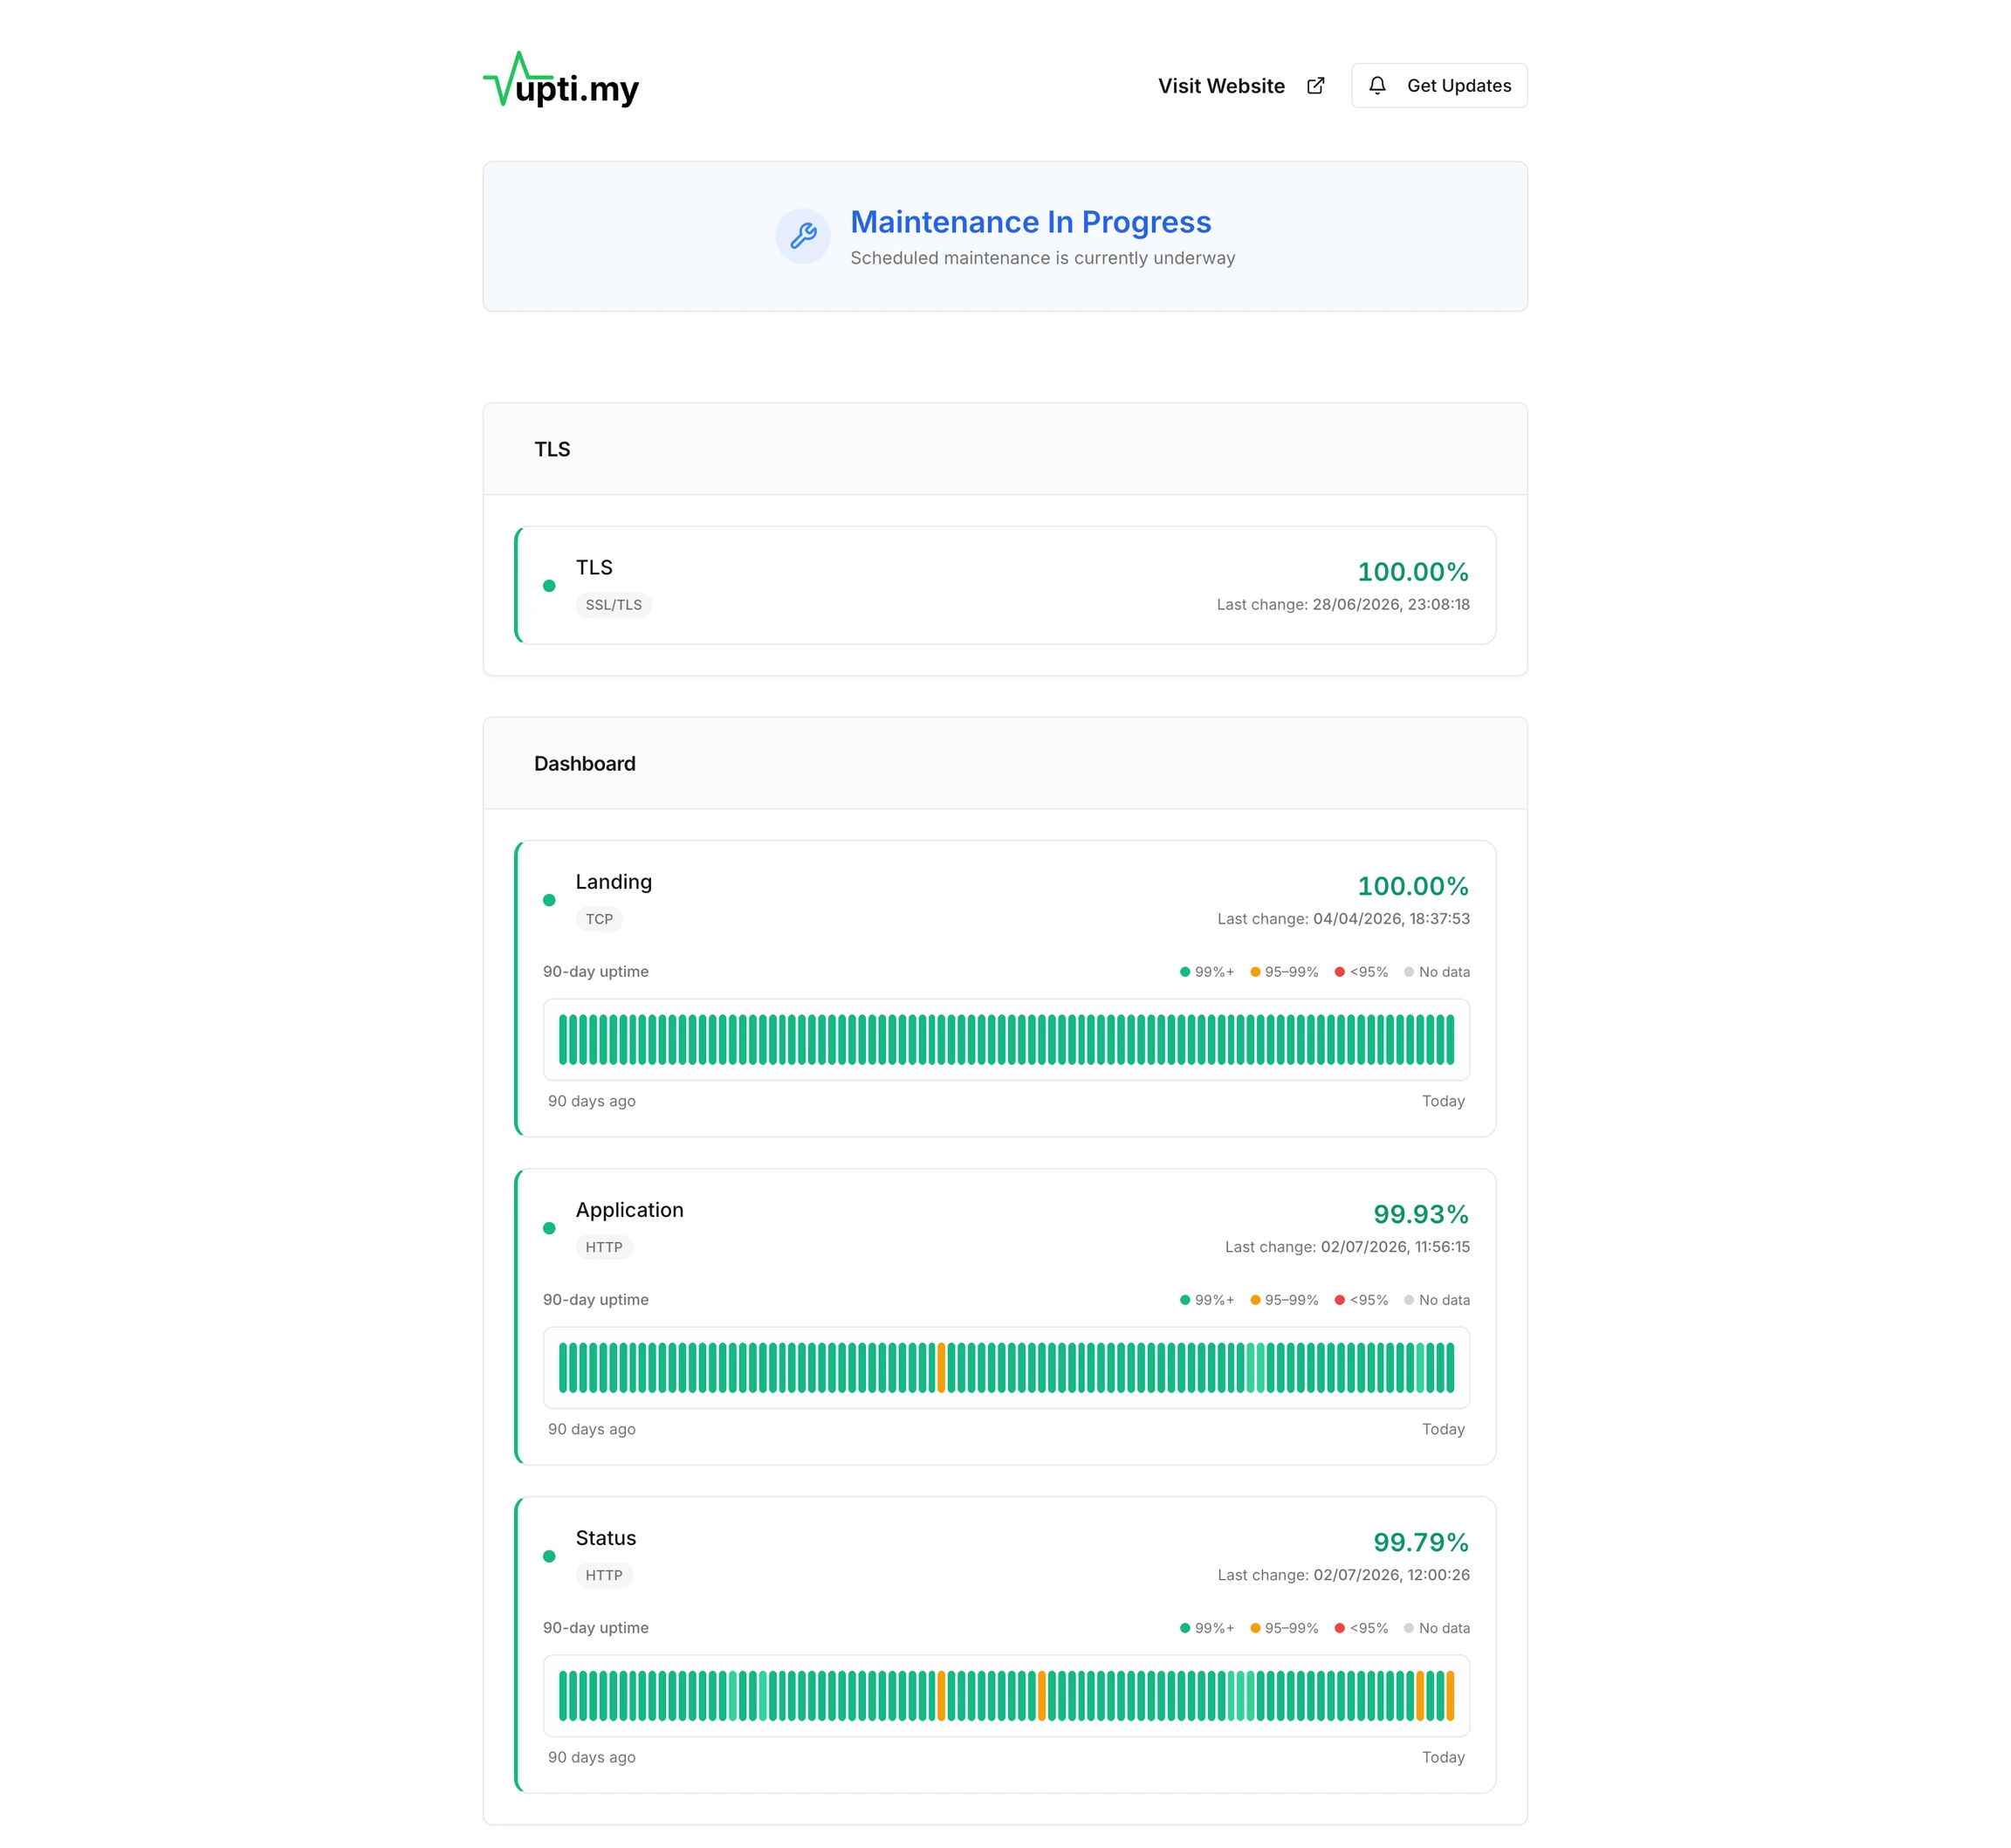
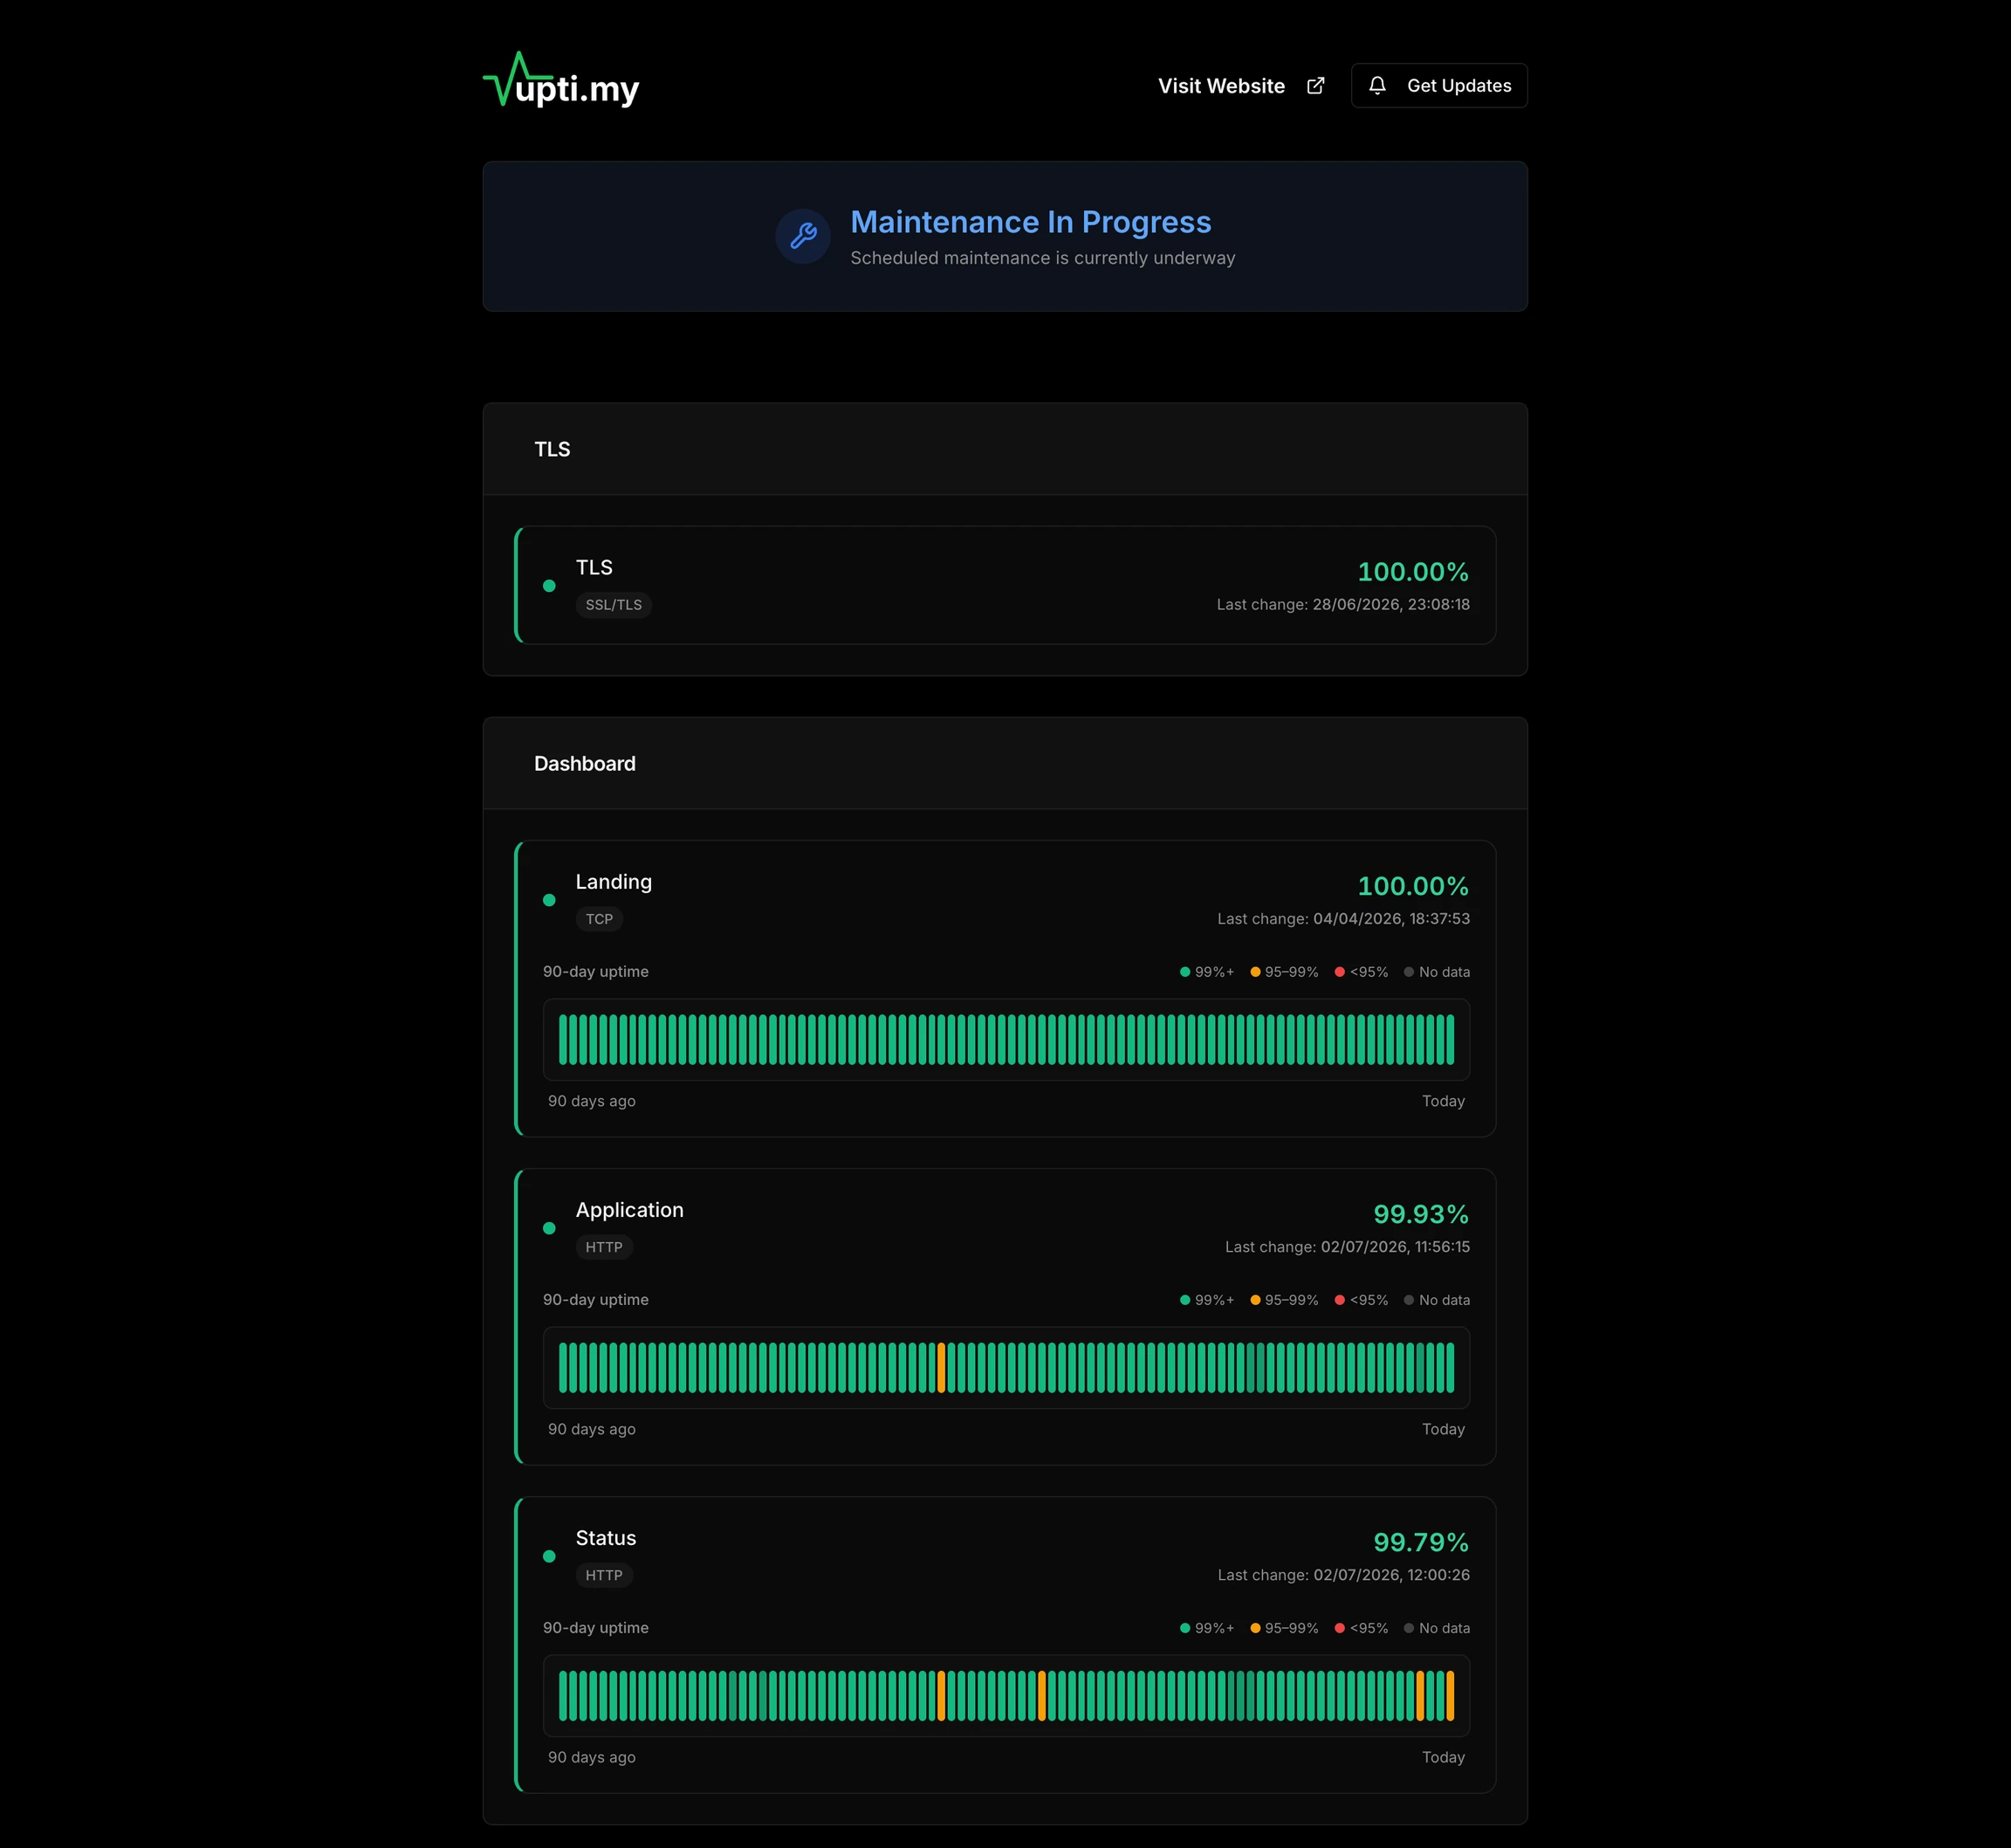
Your status page is often the first place customers look. Give them live service health, 90-day uptime history, and honest incident timelines — whether everything is green or something is on fire.
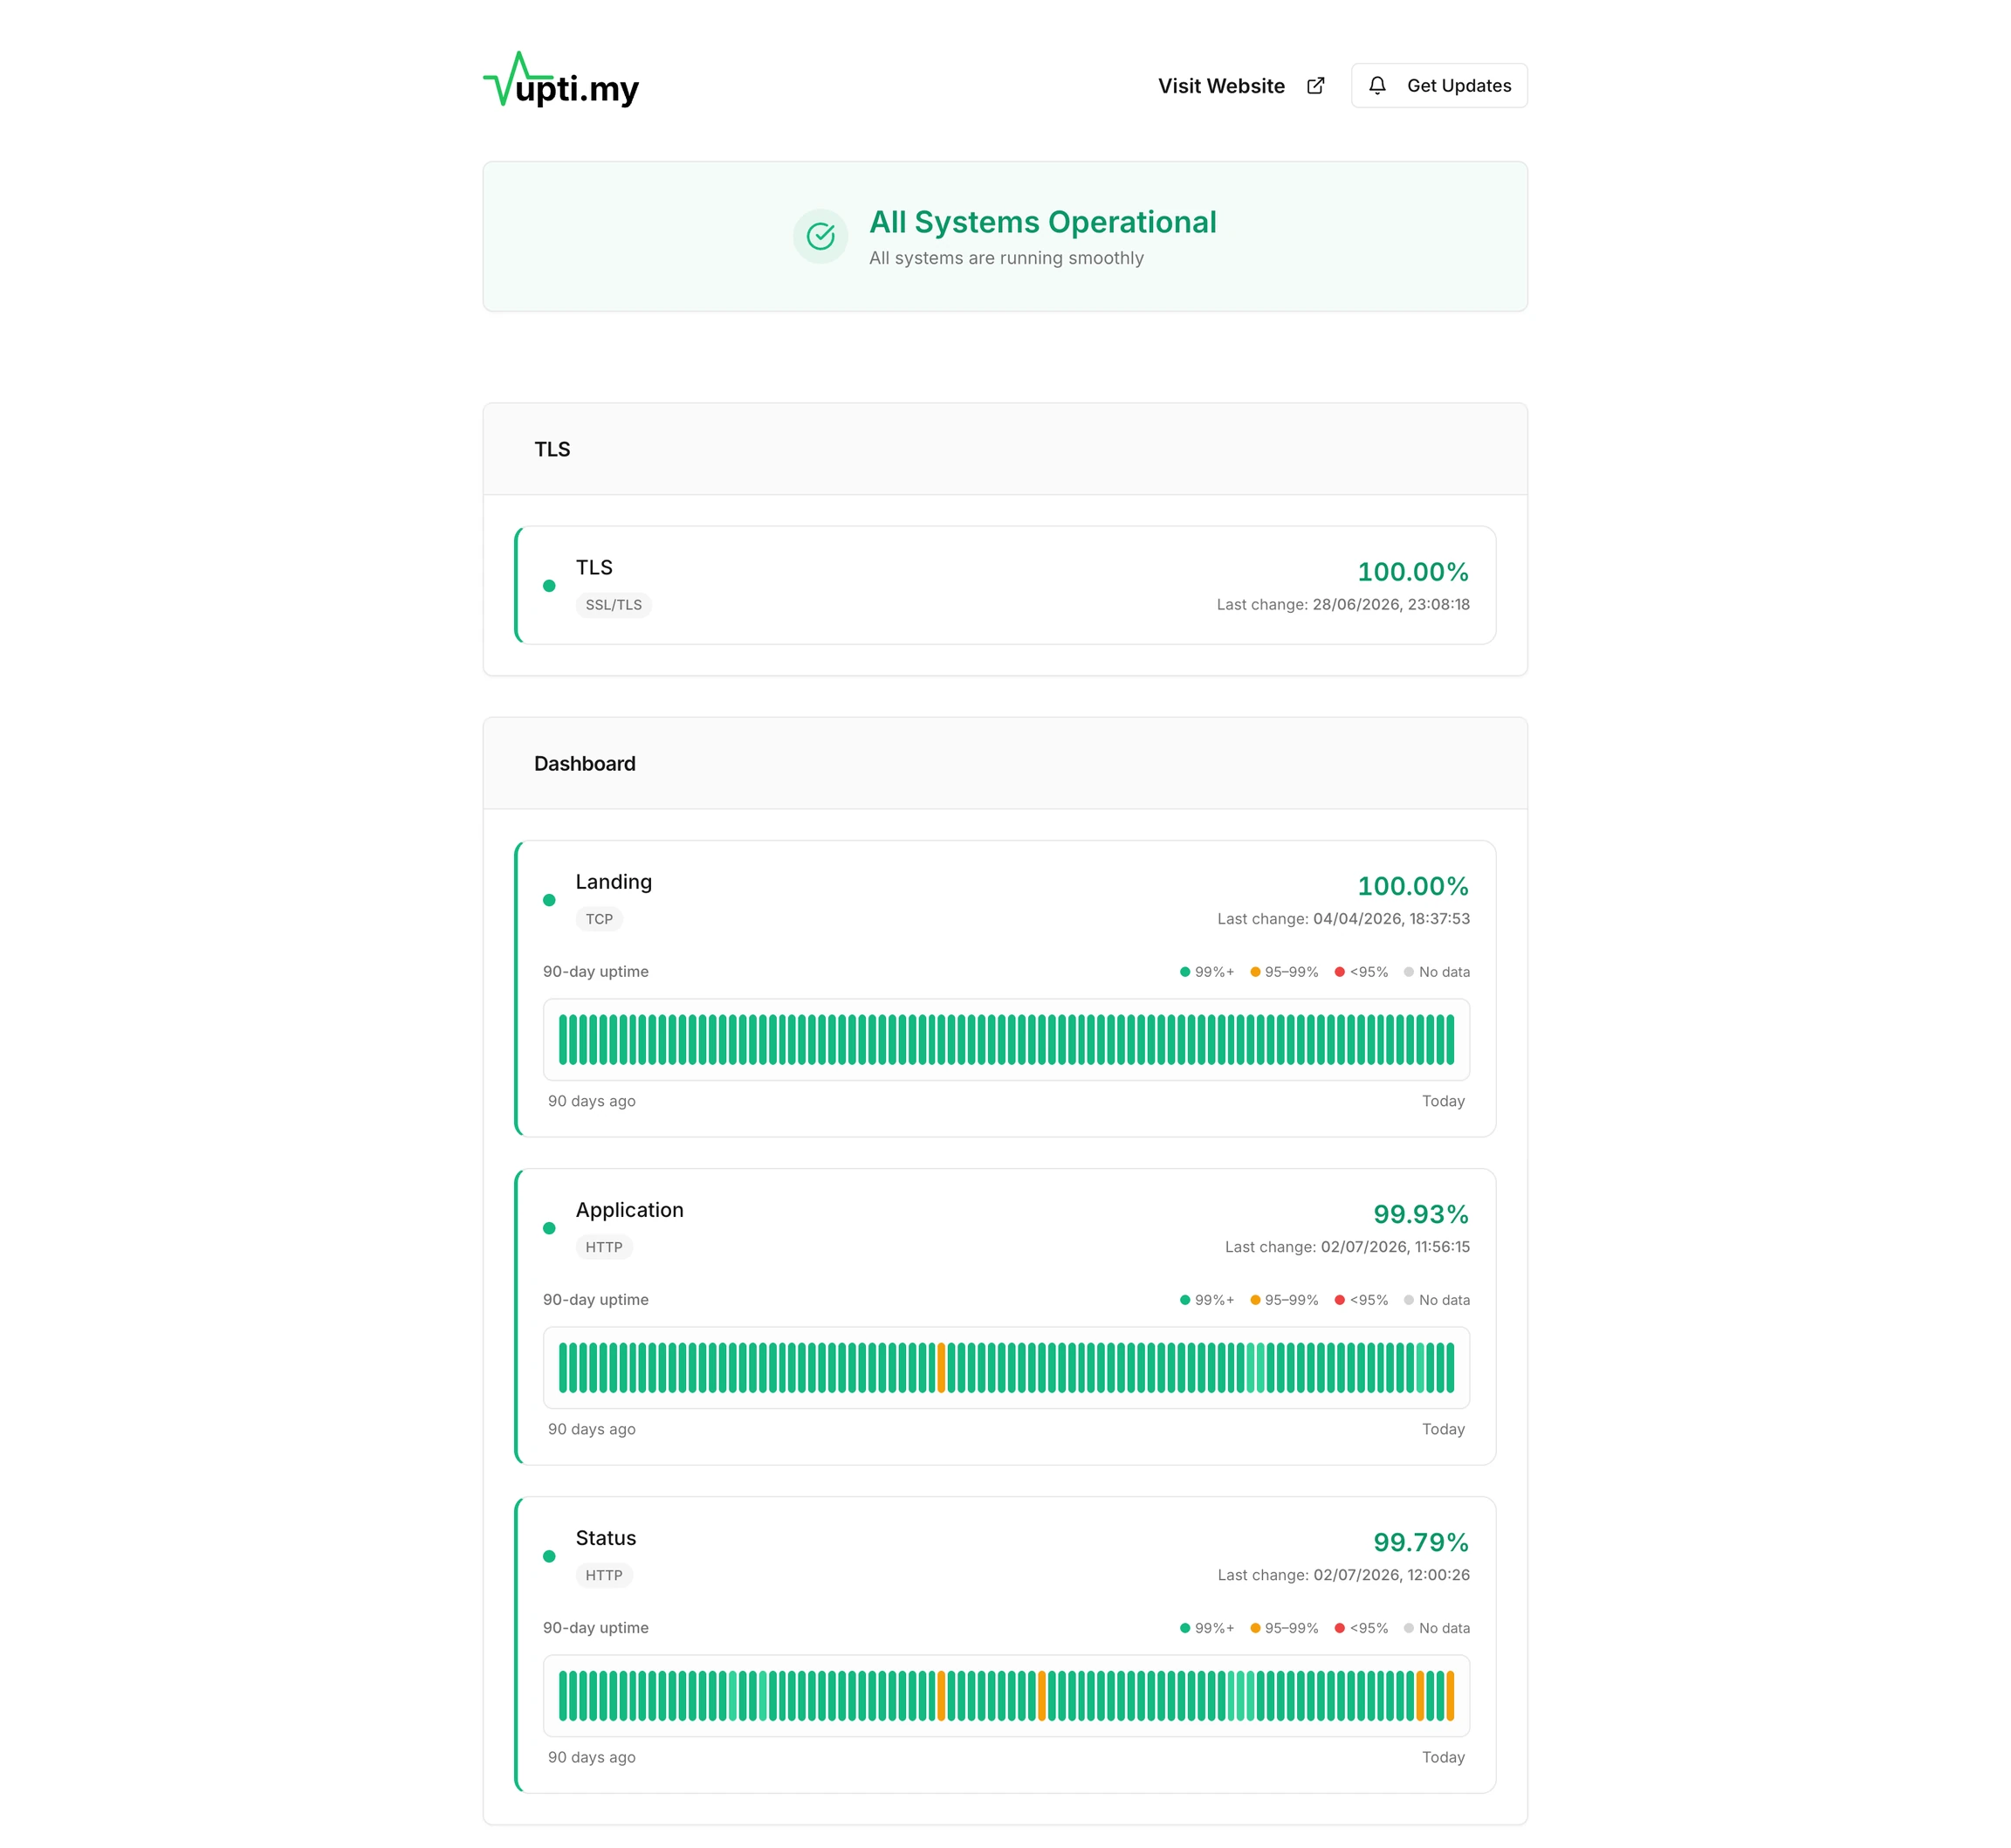
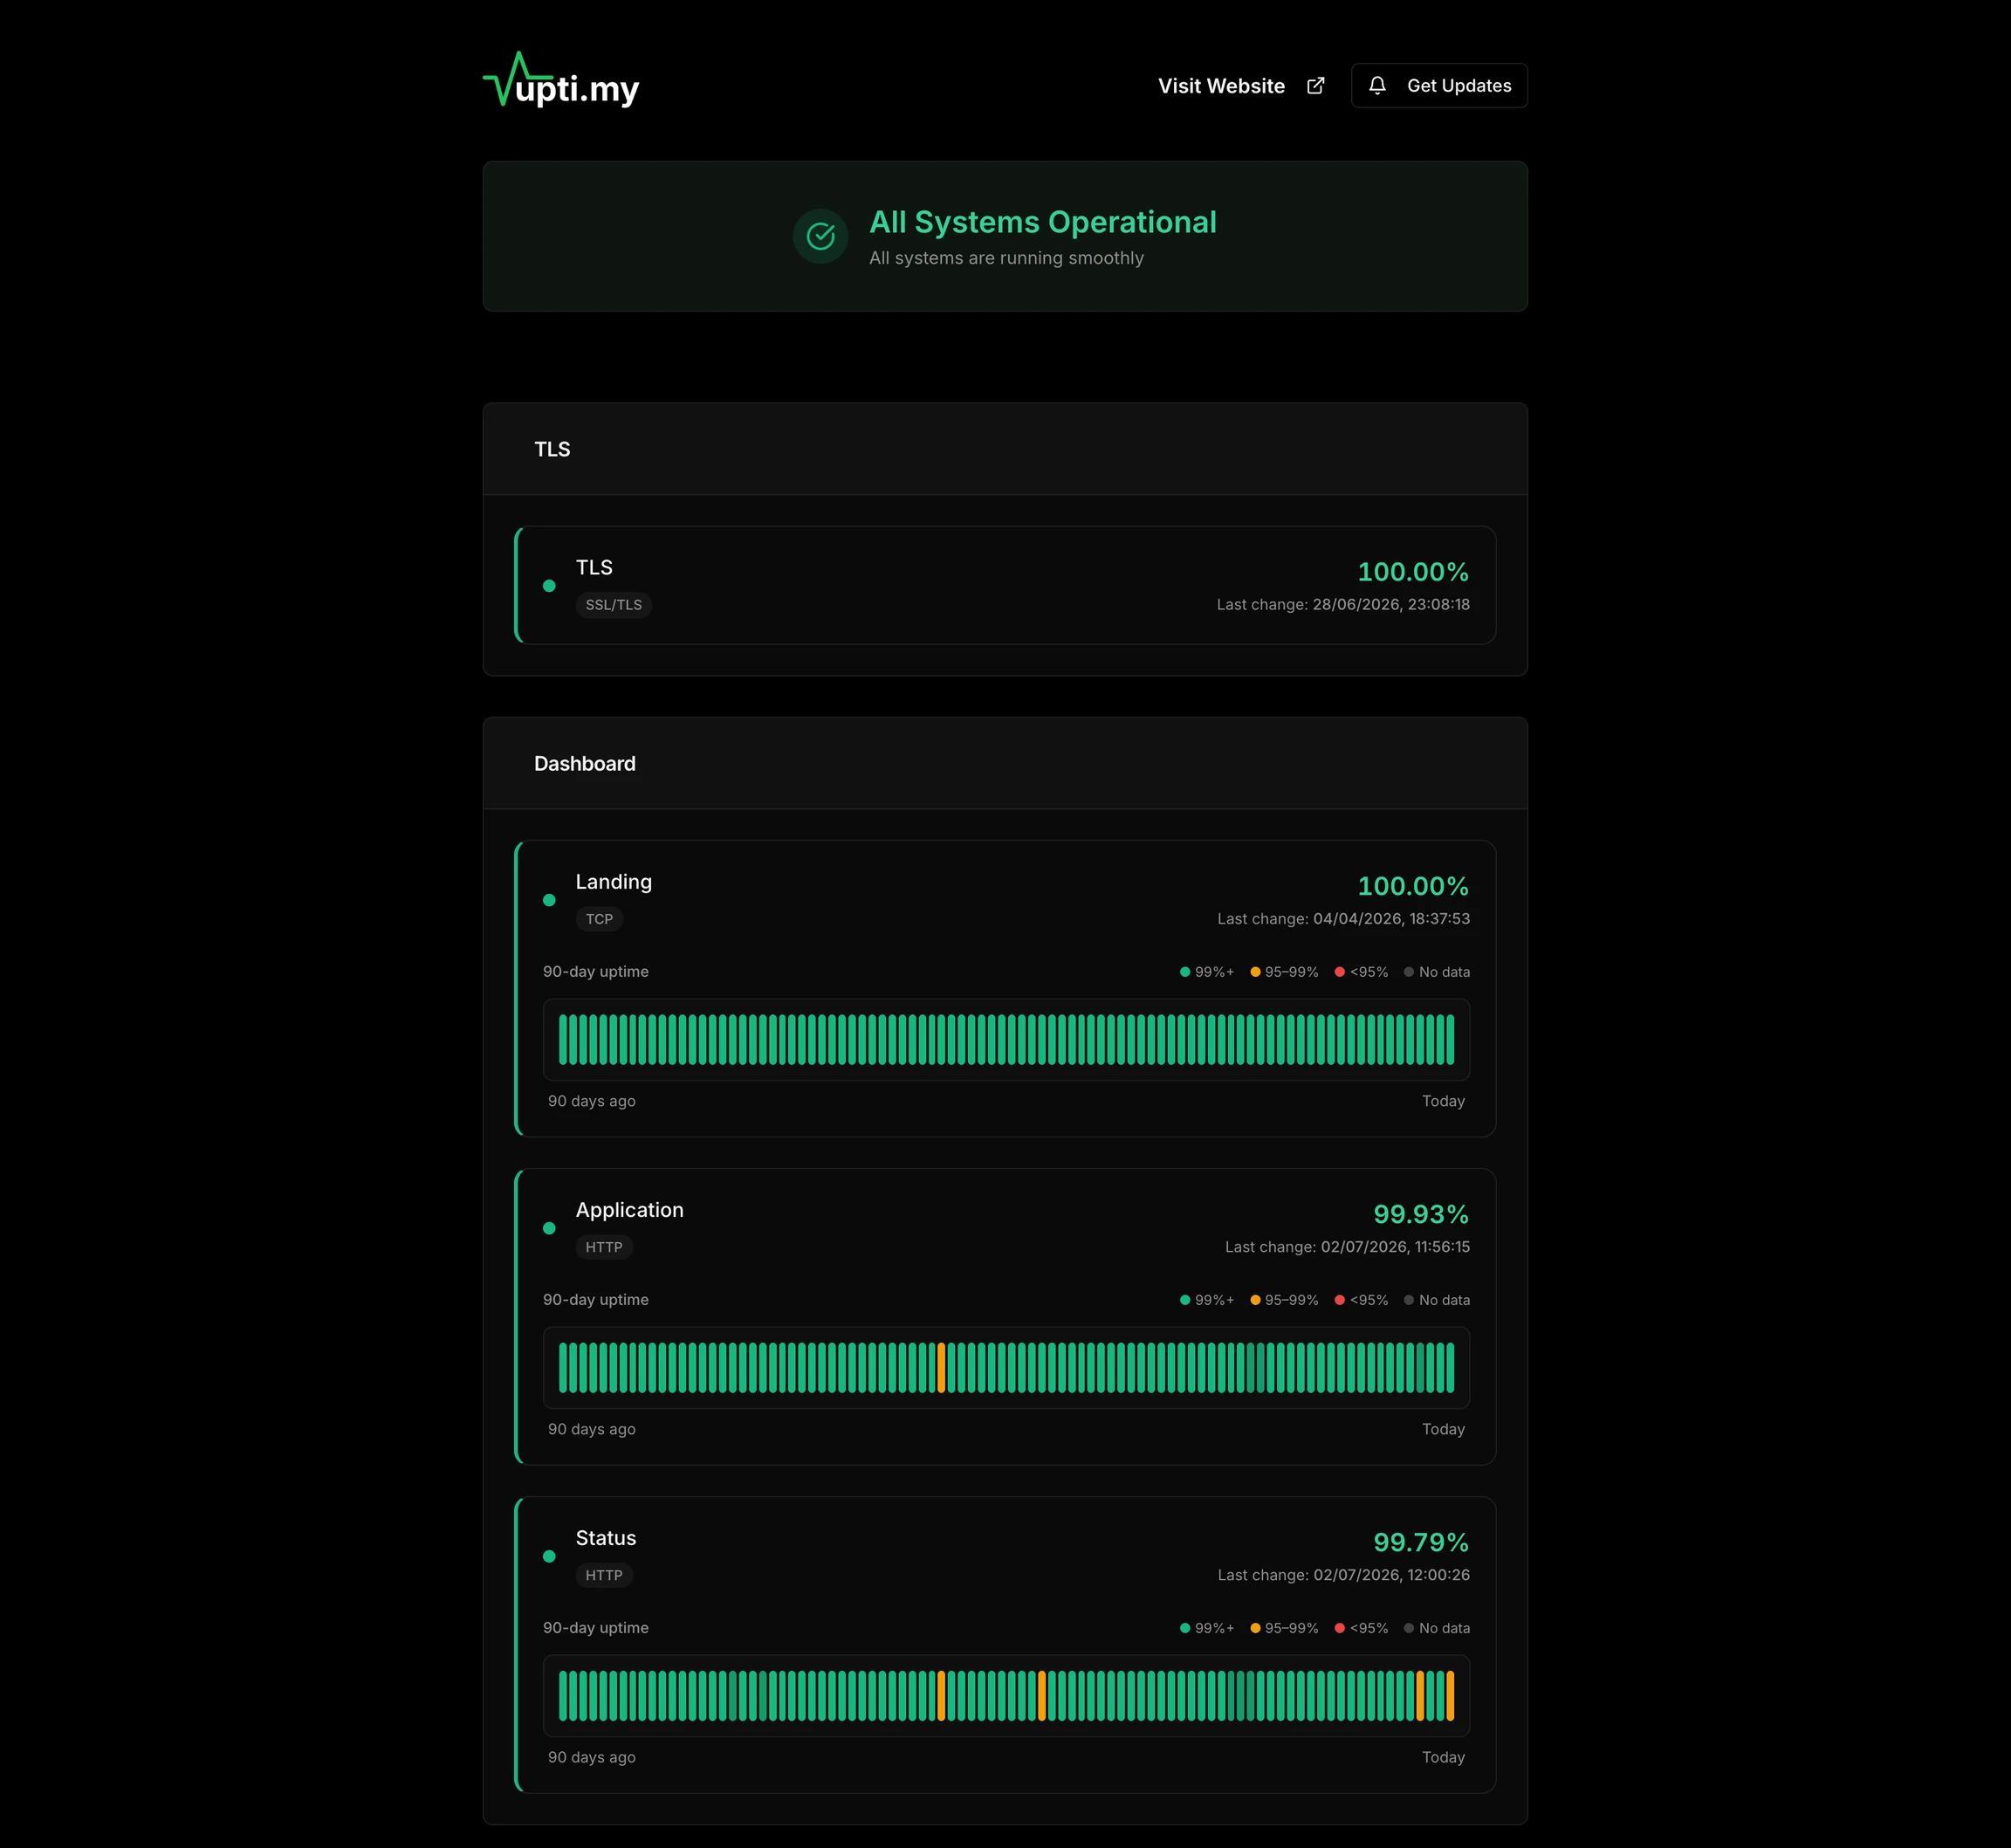
All Systems Operational
All systems are running smoothly
Straight from production: upti.my monitors itself on status.upti.my.
Why Teams Upgrade
Monitoring should not stop at "it failed"
Basic uptime tools tell you a URL failed. upti.my helps your team understand the failure, route the response, keep an incident trail, and communicate clearly while it is being fixed. And when a Railway service crashes, it can restart it for you.
- Pings a URL
- Sends a simple alert
- Usually ends there
- Monitors websites, APIs, jobs, and browser workflows
- Routes alerts to the right people
- Opens an incident trail
- Restarts crashed Railway services automatically
- Supports status page communication
- Helps teams respond like a production operation
Platform Integrations
Monitoring that plugs into your platform
Connect a Railway project with a project token. upti.my discovers the services inside, tracks deploys and crashes through webhooks, and can restart a crashed service without waiting for a human. Vercel and Render are next.
How Railway restarts workDiscovers every service
One project token maps everything in your Railway project, including private services that never expose a public URL.
Tracks state through webhooks
Deploys, crashes, and recoveries arrive as events from the platform instead of being guessed from the outside.
Restarts crashed services
When a service goes down, upti.my can restart it automatically using the same project token, before anyone opens the Railway dashboard.
Testimonials (we wrote these ourselves)
160+ teams already monitor production with upti.my — but our early customers are busy monitoring production, so these are placeholders. The product is real. The quotes, less so.
“Please stop contacting me.”
— One customer, after routing every alert to his phone
“10/10. Woke me up at 3 a.m. That was the point.”
— An on-call engineer, otherwise well rested
“Our cron jobs used to fail silently. Now they fail loudly.”
— A developer who checks heartbeats instead of vibes
Using upti.my and have something real to say? Send us a quote and we will retire one of these.
Pricing for every stage of production reliability
Start with coverage, then upgrade when reliability becomes a shared team process, a customer communication channel, or a multi-product operation.
Choose when
- You are monitoring one small project
- One person owns production response
- A status page with upti.my branding is fine
Plan shape
View capacity limits
Choose when
- You are done with upti.my branding on your status page
- You want 60-second checks instead of 5-minute
- You need private status pages for internal visibility
Plan shape
View capacity limits
Choose when
- You need browser checks for login, checkout, and signup flows
- Your status page should live on your own domain
- Alerts need routing to the right owner
Plan shape
View capacity limits
Choose when
- You run monitoring and status pages for multiple clients
- Each client needs their own branded status page
- You need higher limits across checks, seats, and subscribers
Plan shape
View capacity limits
Choose when
- You need SSO, custom SLAs, or procurement
- Your usage or subscriber limits are custom
- You want full white-labeling and dedicated support
Plan shape
View capacity limits
Become a founding customer
160+ teams already monitor production with upti.my, and Early Access pricing ends when we reach 500. Founding customers get personal onboarding, a direct line to the team, and a real say in the roadmap — plus 30% off Growth and Scale for their entire first year. Once Early Access closes, the offer is gone.
Need every detail?
Compare all limits and features across Free, Starter, Growth, Scale, and Enterprise.
View Detailed ComparisonFrequently Asked Questions
Direct answers for teams deciding whether upti.my fits their production reliability workflow.
No. Paste a domain and upti.my discovers the public services worth monitoring, so you start with real coverage instead of an empty dashboard. From there, teams add heartbeats for background jobs, alert routing, incidents, and status pages as their reliability process matures.
upti.my confirms the signal, sends alerts through your configured routes, creates an incident timeline, and can update a connected status page. Your team gets the context needed to respond without rebuilding the story from scattered tools.
On Railway, yes. Connect a project token and upti.my discovers the services in your project, including private ones without a public URL, tracks their state through webhooks, and can restart a crashed service automatically. More platforms, starting with Vercel and Render, are on the roadmap.
upti.my monitors itself with the same checks it runs for customers, and publishes its own uptime and incident history at status.upti.my. If we ever have an issue, you can see it there in the open — the same transparency we help you give your own customers.
Failures are confirmed from multiple locations before anyone is paged, and you control check intervals, confirmation thresholds, and failure rules per monitor. The goal is simple: when upti.my wakes you up, there is a real problem worth waking up for.
upti.my monitors websites, APIs, background jobs, webhooks, and browser workflows. Teams use it for public pages, app endpoints, scheduled jobs, data imports, checkout paths, login flows, and customer-facing status pages.
A basic uptime monitor usually pings one URL and sends a simple alert. upti.my covers more product surfaces, routes alerts to the right people, opens an incident trail, and helps teams communicate clearly through status pages.
Yes. Alerts can reach teams through email, Slack, Discord, webhooks, and other notification paths. You can route different services or failure types to different owners.
Yes. Heartbeats tell upti.my when a scheduled task or worker last checked in, so missed runs, stalled imports, failed reports, and delayed jobs are visible before customers report stale data.
Yes. Incidents keep checks, alerts, timeline events, owners, and status communication together so responders do not have to rebuild context while the product is down.
upti.my is built for production teams that own customer-facing software and need confidence that websites, APIs, jobs, and browser workflows are working.
Start Before Customers Notice
Stop wondering if production is okay
Start with one monitor, heartbeat, or browser workflow. upti.my will help you know when something breaks, respond with context, and keep customers informed.
Free plan available · No credit card required · Cancel anytime