

Uptimy Agent · open source
Uptime monitoring that runs inside your cluster
9 MB image · 8 MiB of memory idle · Docker, Kubernetes and Railway
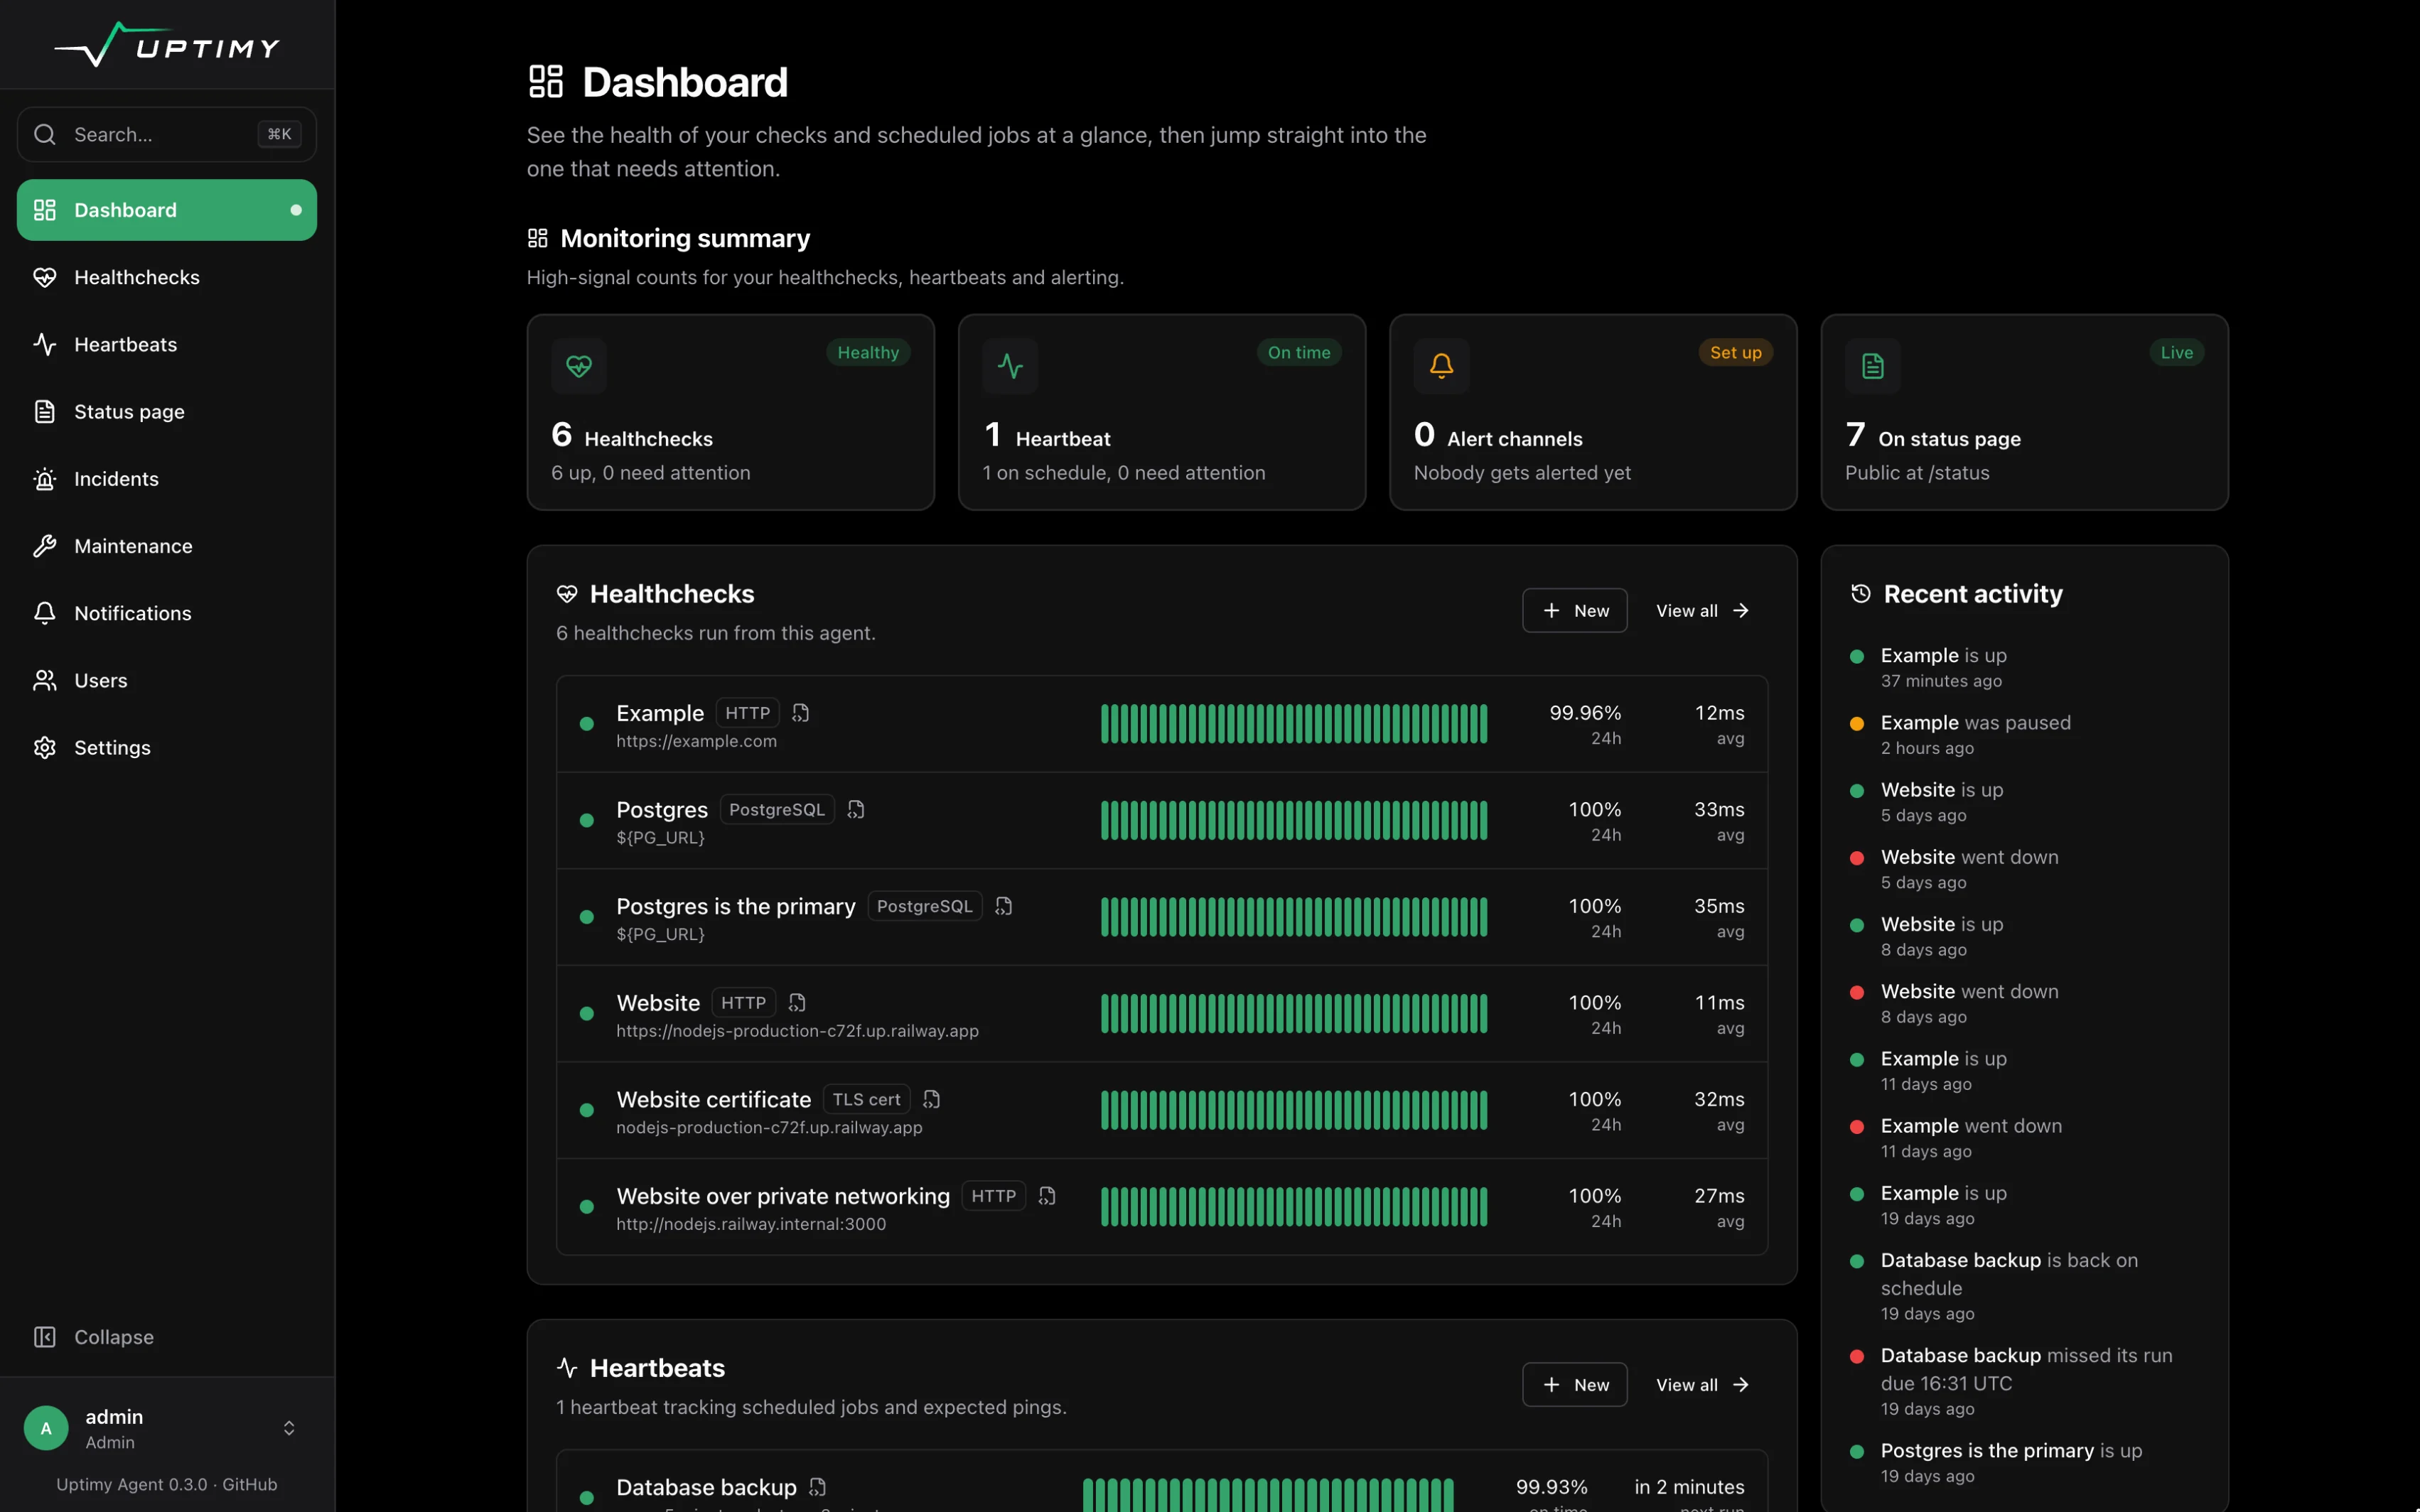
What it checks
Websites and APIs
HTTP(S) with status codes and keywords, TCP, ping, DNS and TLS certificate expiry.
Databases
Postgres, MySQL and Redis with a real login and query. Catch a failover with SELECT pg_is_in_recovery().
Kubernetes
Services, Ingresses, Deployments and CronJobs, found from a label and checked from inside the cluster.
Cron jobs and workers
Heartbeats on an interval or a cron schedule in any time zone, with missed and failed runs, exit codes and durations.
Private services
postgres.default.svc, api.railway.internal and anything else the agent can reach, without exposing it.
Alerts and a status page
Email, Slack, Teams, Discord, Telegram, PagerDuty, webhooks and 30+ more, retried for up to an hour if a channel is down, plus a public status page with your logo.
On Kubernetes, label it and it's monitored
helm install uptimy-agent oci://ghcr.io/uptimy/charts/uptimy-agent -n monitoring --create-namespace
kubectl -n shop label service checkout upti.my/monitor=true
kubectl -n shop label cronjob backup upti.my/monitor=trueRuns anywhere
Docker
docker run -d --name uptimy-agent -p 8080:8080 \
  -v uptimy-agent:/data ghcr.io/uptimy/agent
Railway
One click adds the agent to your project, with a volume and a generated password. It reaches your *.railway.internal services and databases from there. Settings → Import from Railway turns every service in the project into a monitor from a project token.

Switching from Uptime Kuma
Connect it to Uptimy Cloud
Frequently Asked Questions
Yes. It's open source under Apache-2.0 and complete on its own: monitors, alerts, a status page and multiple users, with no limits and no account. Connecting it to Uptimy is optional.
No. It runs anywhere Docker runs, as a single binary, or on Railway. Inside a cluster it adds Kubernetes checks and discovery from labels.
The agent becomes a private location in your Uptimy workspace. Its monitors show up there with status, uptime and history, so you can put them on status pages, in SLA reports, workflows and on-call. Uptimy also alerts you from outside when the agent, its server or the whole cluster goes quiet. Agent monitors don't count toward your plan's monitor limits, and a free account connects one agent.
It's built to run next to your services rather than as a standalone dashboard: monitors can come from Kubernetes labels or YAML, CronJobs are tracked without pings, and it uses a fraction of the memory. Kuma has far more monitor types and notification services built in. The comparison page goes through both sides.
23:00 · goodnight
Watch what your users can't see.
Uptimy Agent is open source and runs in a minute. Give it a label, and it tells you before your customers do.